



India’s electricity-demand pattern during May this year differed from previous years not only in the scale of peak demand, but also in the persistence and timing of load across the day.
More importantly, the demand floor remained elevated throughout the month and did not rise only during isolated heat-wave spikes.
Data from Thurro platform shows solar-hour demand exceeded non-solar-hour demand on 20 of 26 days tracked in May 2026 so far, compared with 12 of 31 days in 2025, 26 of 31 days in 2024, and 21 of 31 days in 2023. The shift became materially more visible during the second half of May.
The demand surge
The key change was not only higher peak demand, but the persistence of elevated daytime load across multiple consecutive sessions. All-India peak demand exceeded 250 GW on eight of the nine days between May 18 and May 26, while solar-hour demand remained above 250 GW on most of the days during the second half of May.
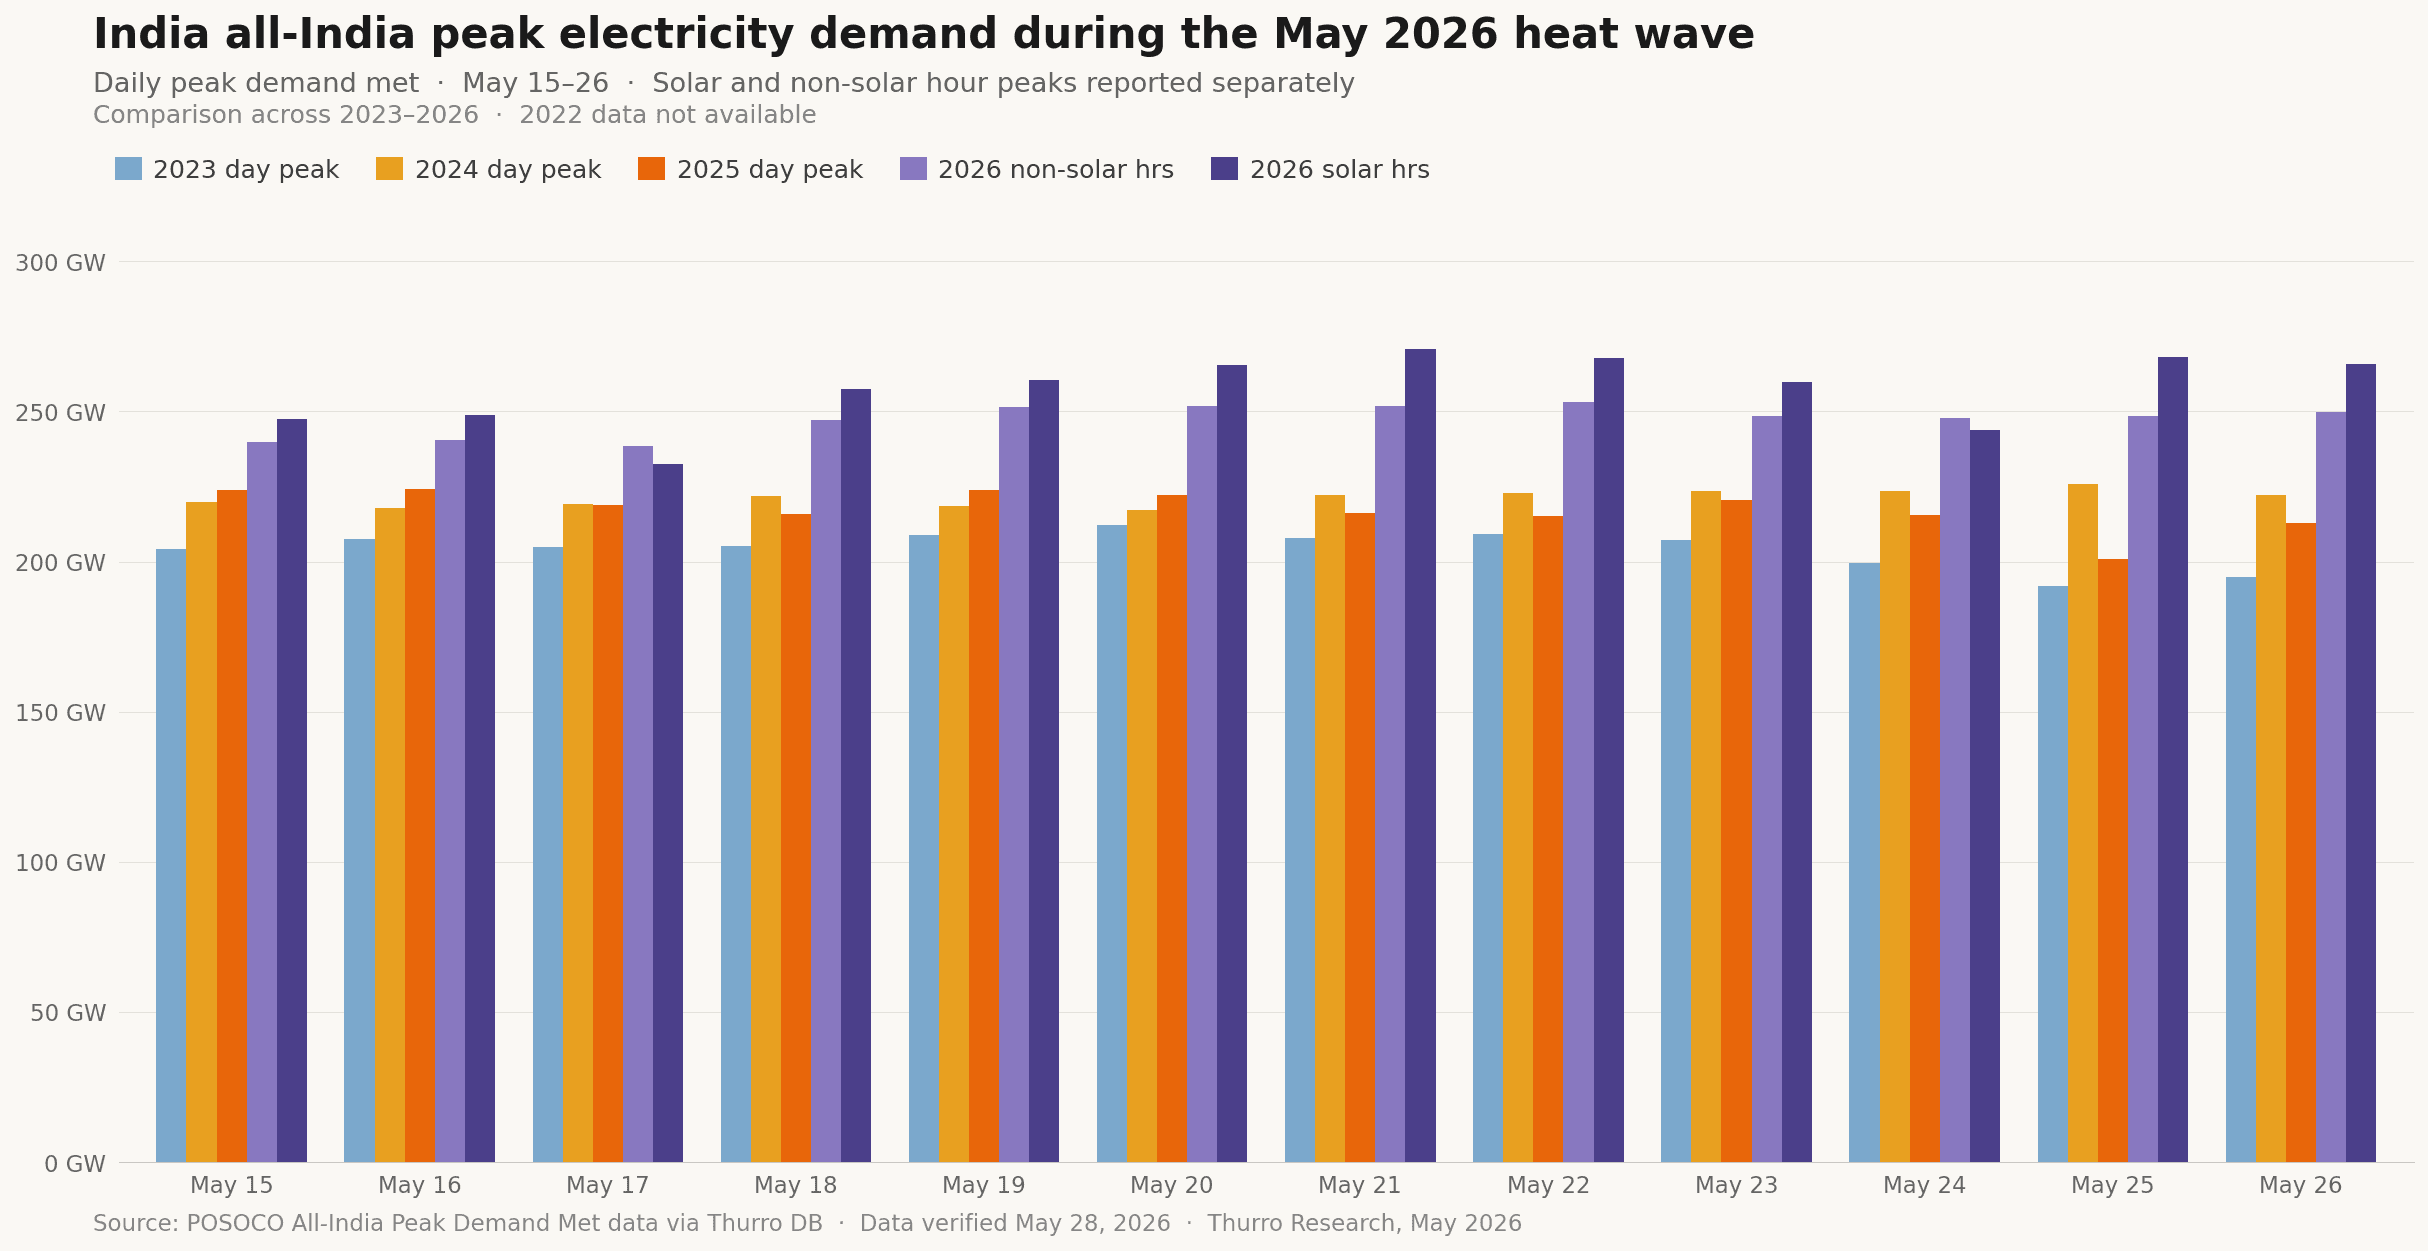
This pattern is consistent with a larger share of peak demand emerging during afternoon hours rather than primarily during evening demand periods.
The broader demand floor was also higher than in earlier years. Average solar-hour demand during May 1–7 stood at 218.9 GW in 2026, compared with 172.5 GW during the same period in 2023. By the May 15–26 window, average solar-hour demand had risen to approximately 260 GW, versus approximately 204 GW in the comparable 2023 period.
The acceleration became materially sharper after May 10. Solar-hour demand rose from 212.7 GW on May 10 to 241.5 GW on May 11, while non-solar-hour demand increased by a smaller margin during the same period. From May 11–26, solar-hour demand did not fall below 232 GW, creating a sustained elevated plateau rather than a short-duration spike.
The persistence of the demand surge was also visible in electricity-market pricing. IEX day-ahead prices rose from INR 3,137 per megawatt hour (MWh) on May 10 to INR 4,377/MWh on May 11, before crossing INR 5,900/MWh on May 13–14. Prices then remained elevated through May 27, with multiple sessions sustaining materially higher pricing levels and several intraday blocks continuing to hit the INR 10,000/MWh ceiling.
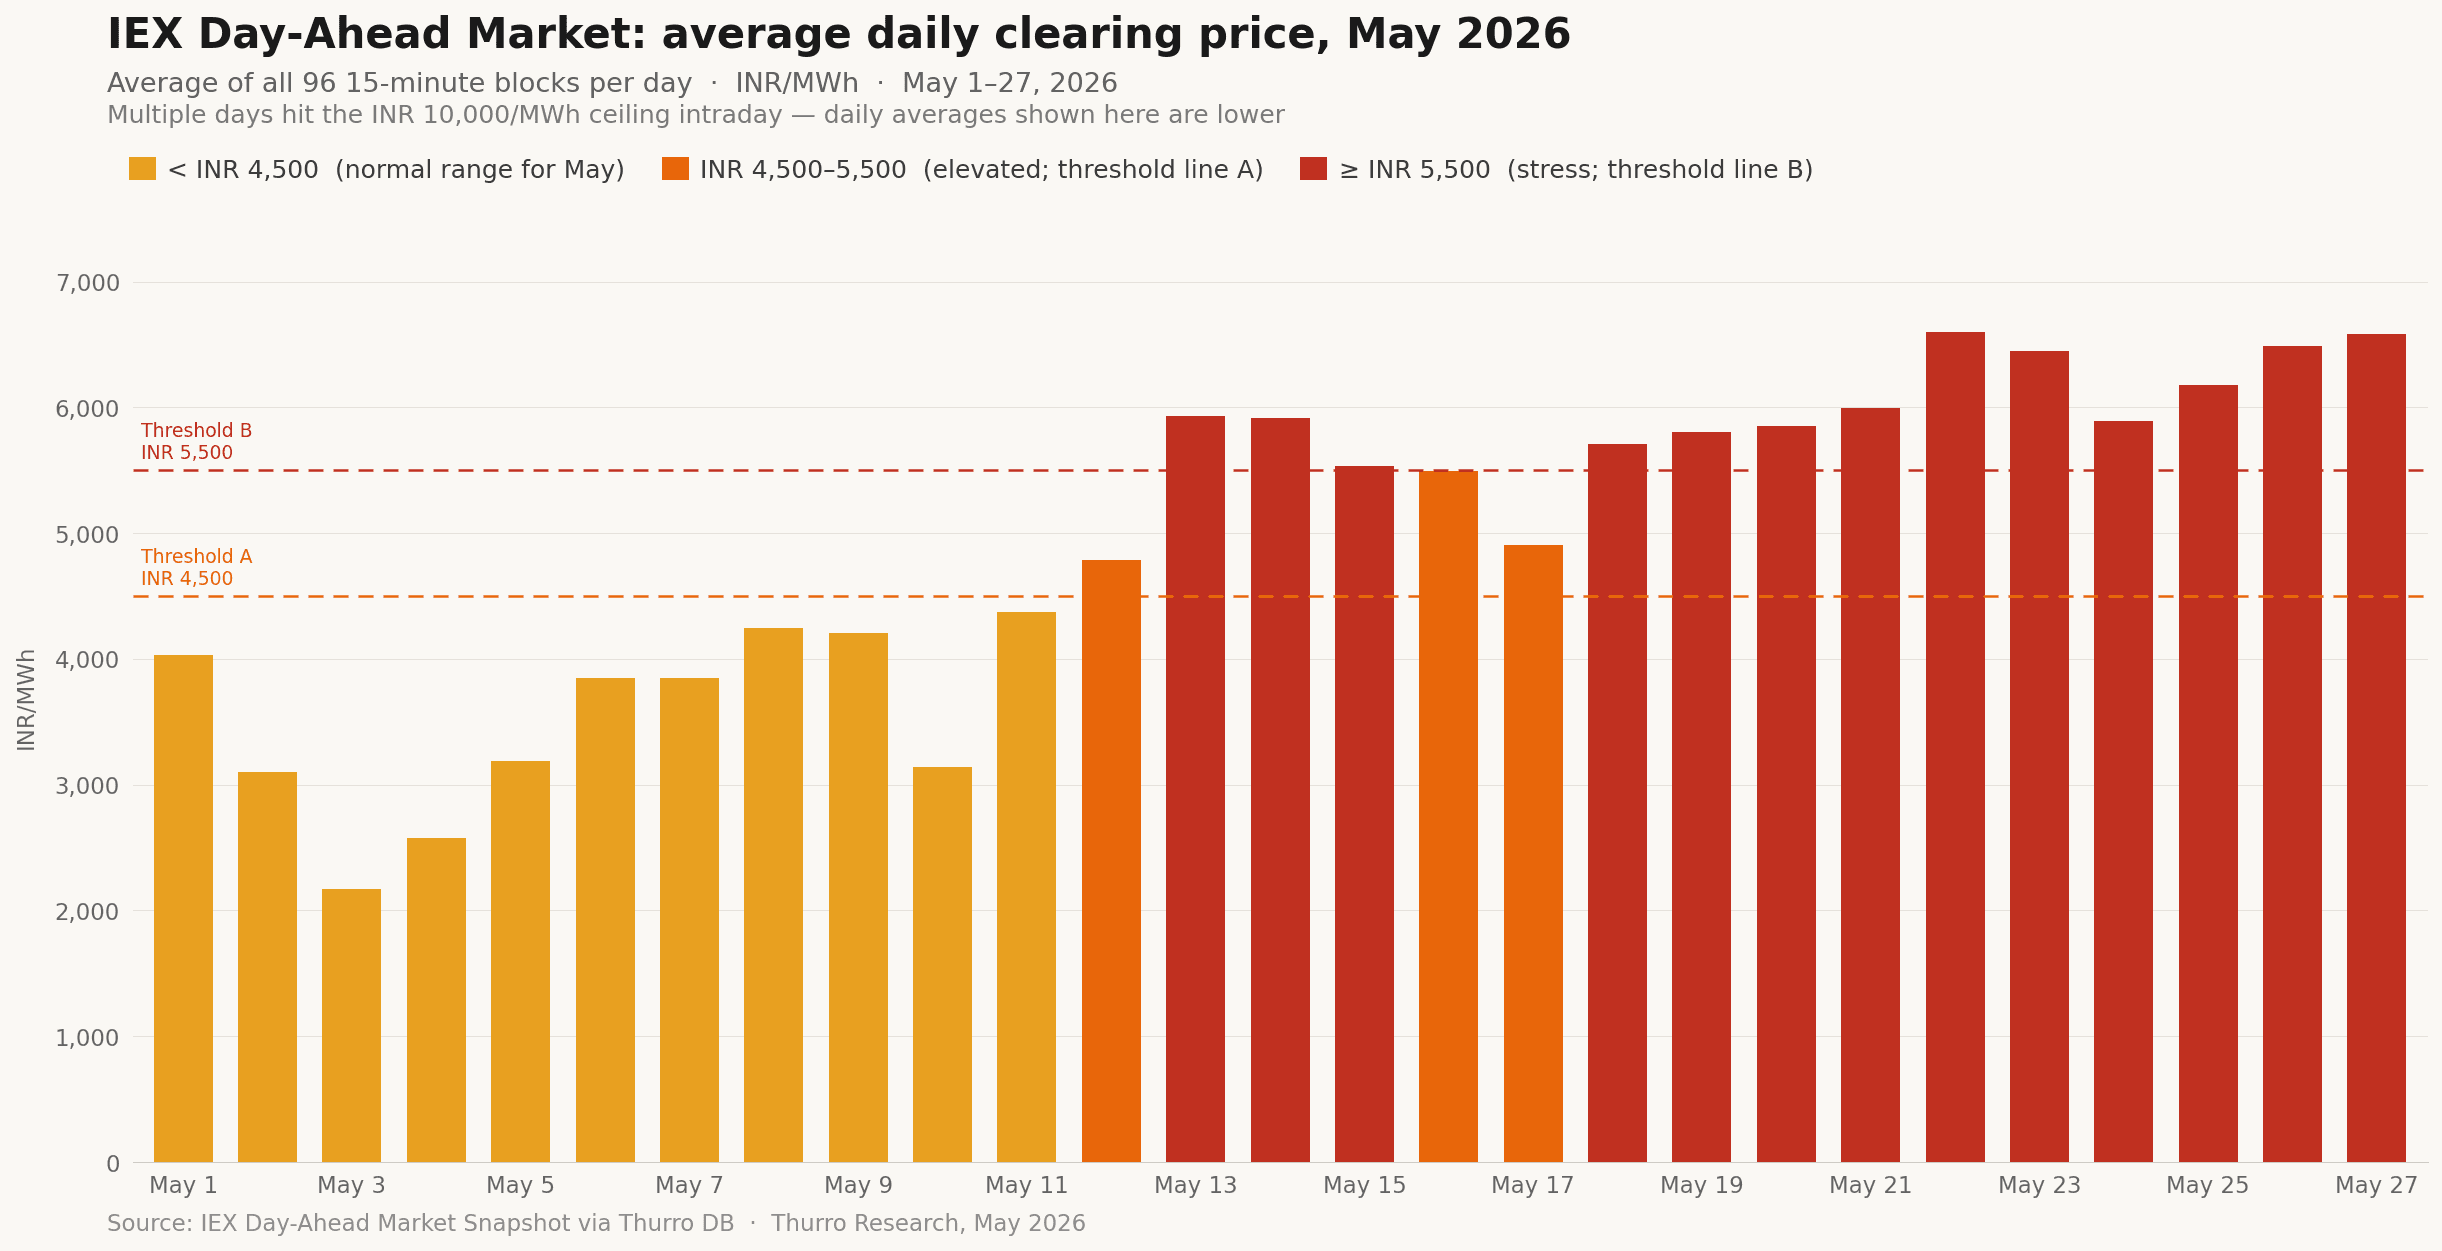
This price stickiness suggested the demand surge was not episodic, but sustained across multiple trading sessions.
The elevated non-solar-hour floor also points to a broader industrial and commercial demand base operating alongside the cooling surge.
Uneven patterns
The local electricity data on Thurro also shows that different regions produced materially different electricity-demand profiles.
For the analysis, Thurro tracked quarterly electricity consumption across 25 disclosed distribution areas—covering approximately 35 million end consumers—operated by Torrent Power, CESC, Adani Energy Solutions, and Tata Power.
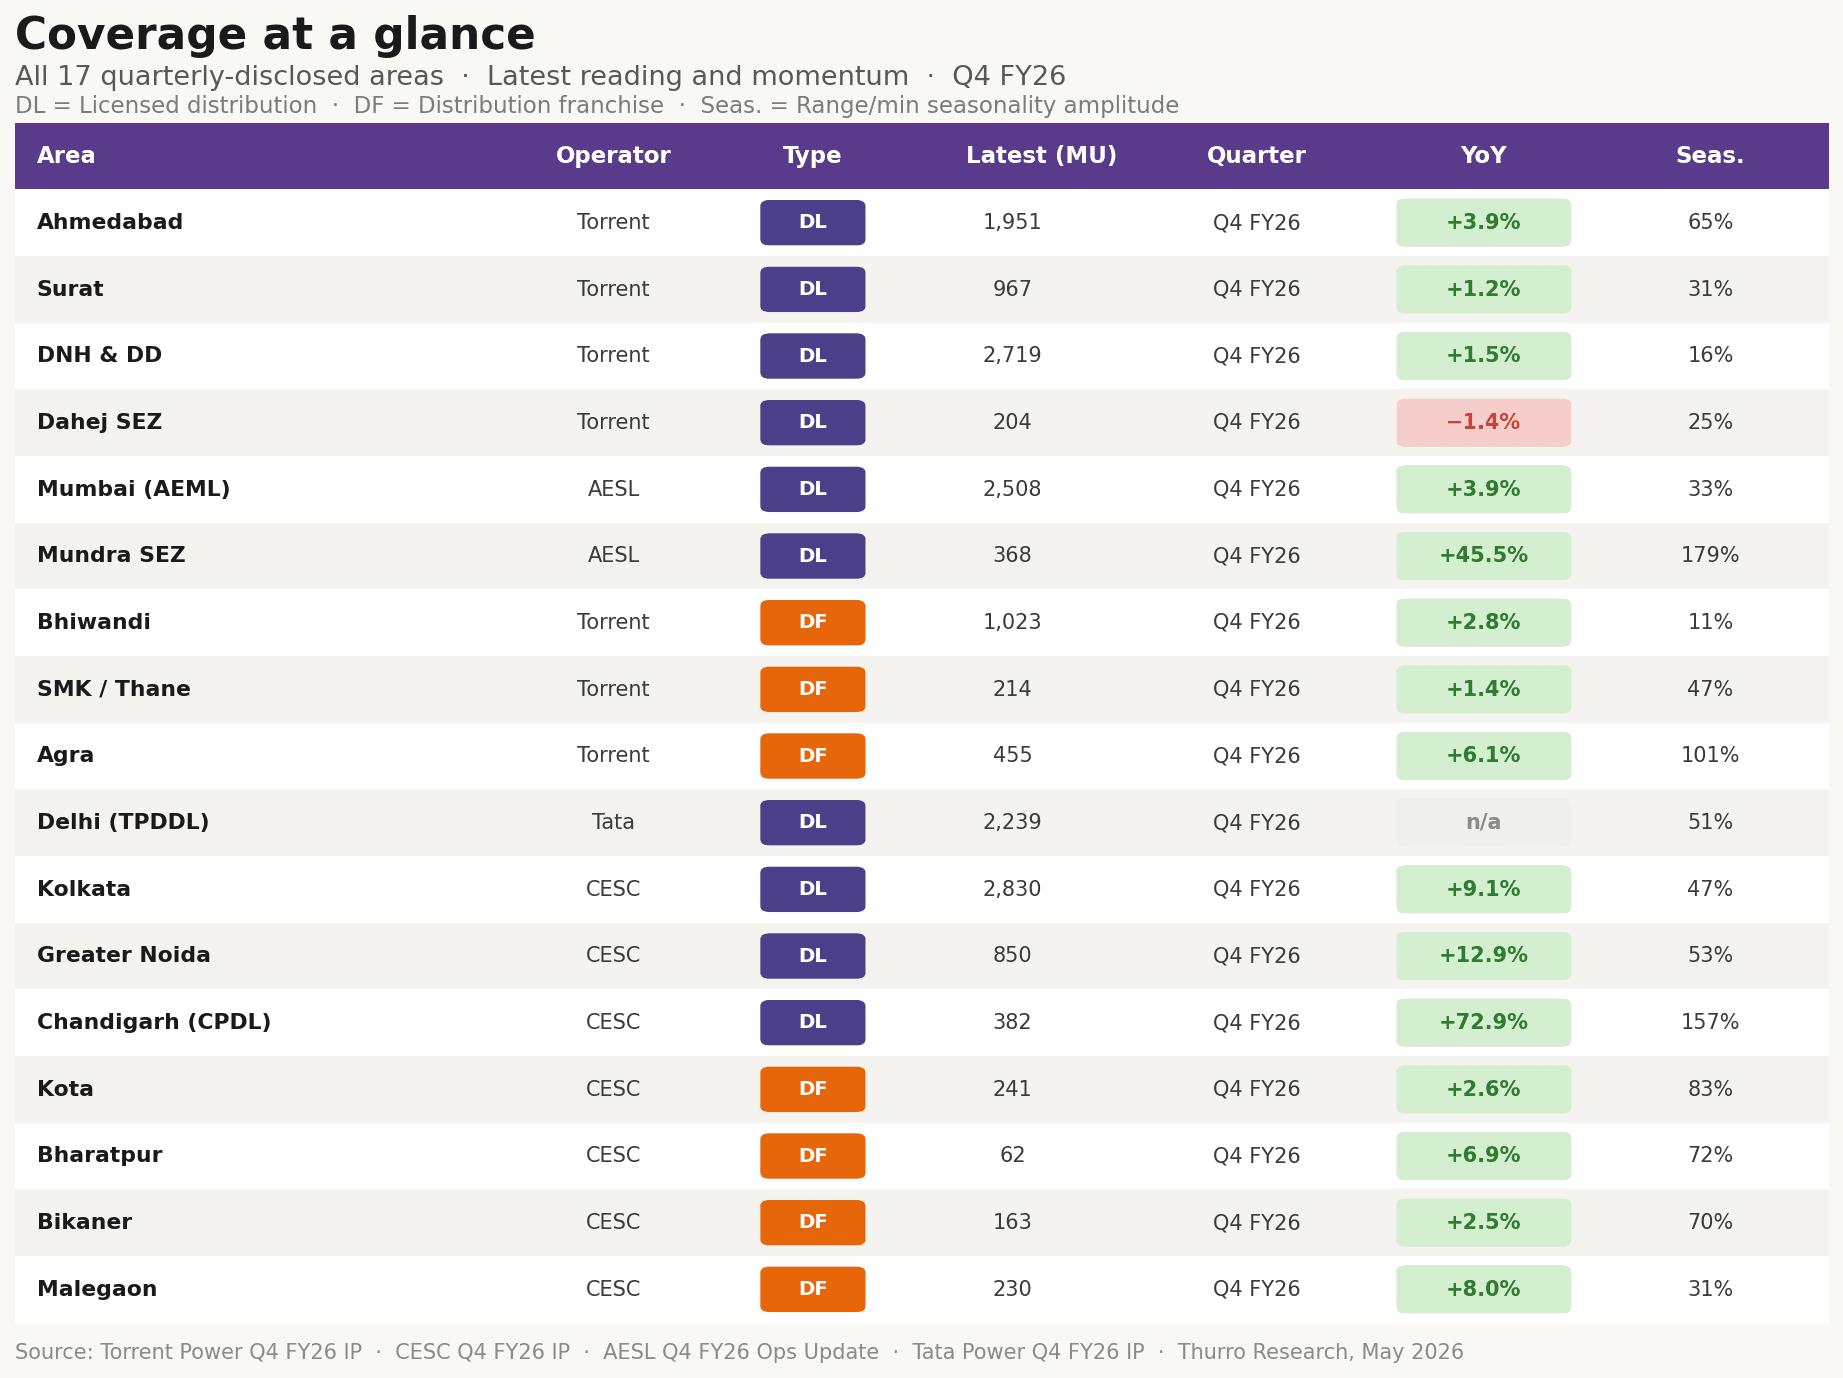
These are among the few listed electricity-distribution operators in India that disclose area-level quarterly electricity-consumption data with sufficient historical consistency for comparative analysis. The tracker focuses only on areas where operators disclose quarterly unit-sales or unit-purchase data consistently over time, allowing comparison of seasonality, growth, and demand profiles across residential, industrial, and urban demand centres.
Residential and weather-sensitive markets such as Agra, Ahmedabad, Kolkata, and Greater Noida displayed sharper seasonal swings, with seasonality amplitudes ranging from 48 to 101. By contrast, industrial areas such as Bhiwandi and Dadra & Nagar Haveli and Daman & Diu (DNH&DD) recorded amplitudes of 11 and 16 respectively, indicating comparatively lower seasonality in electricity demand.
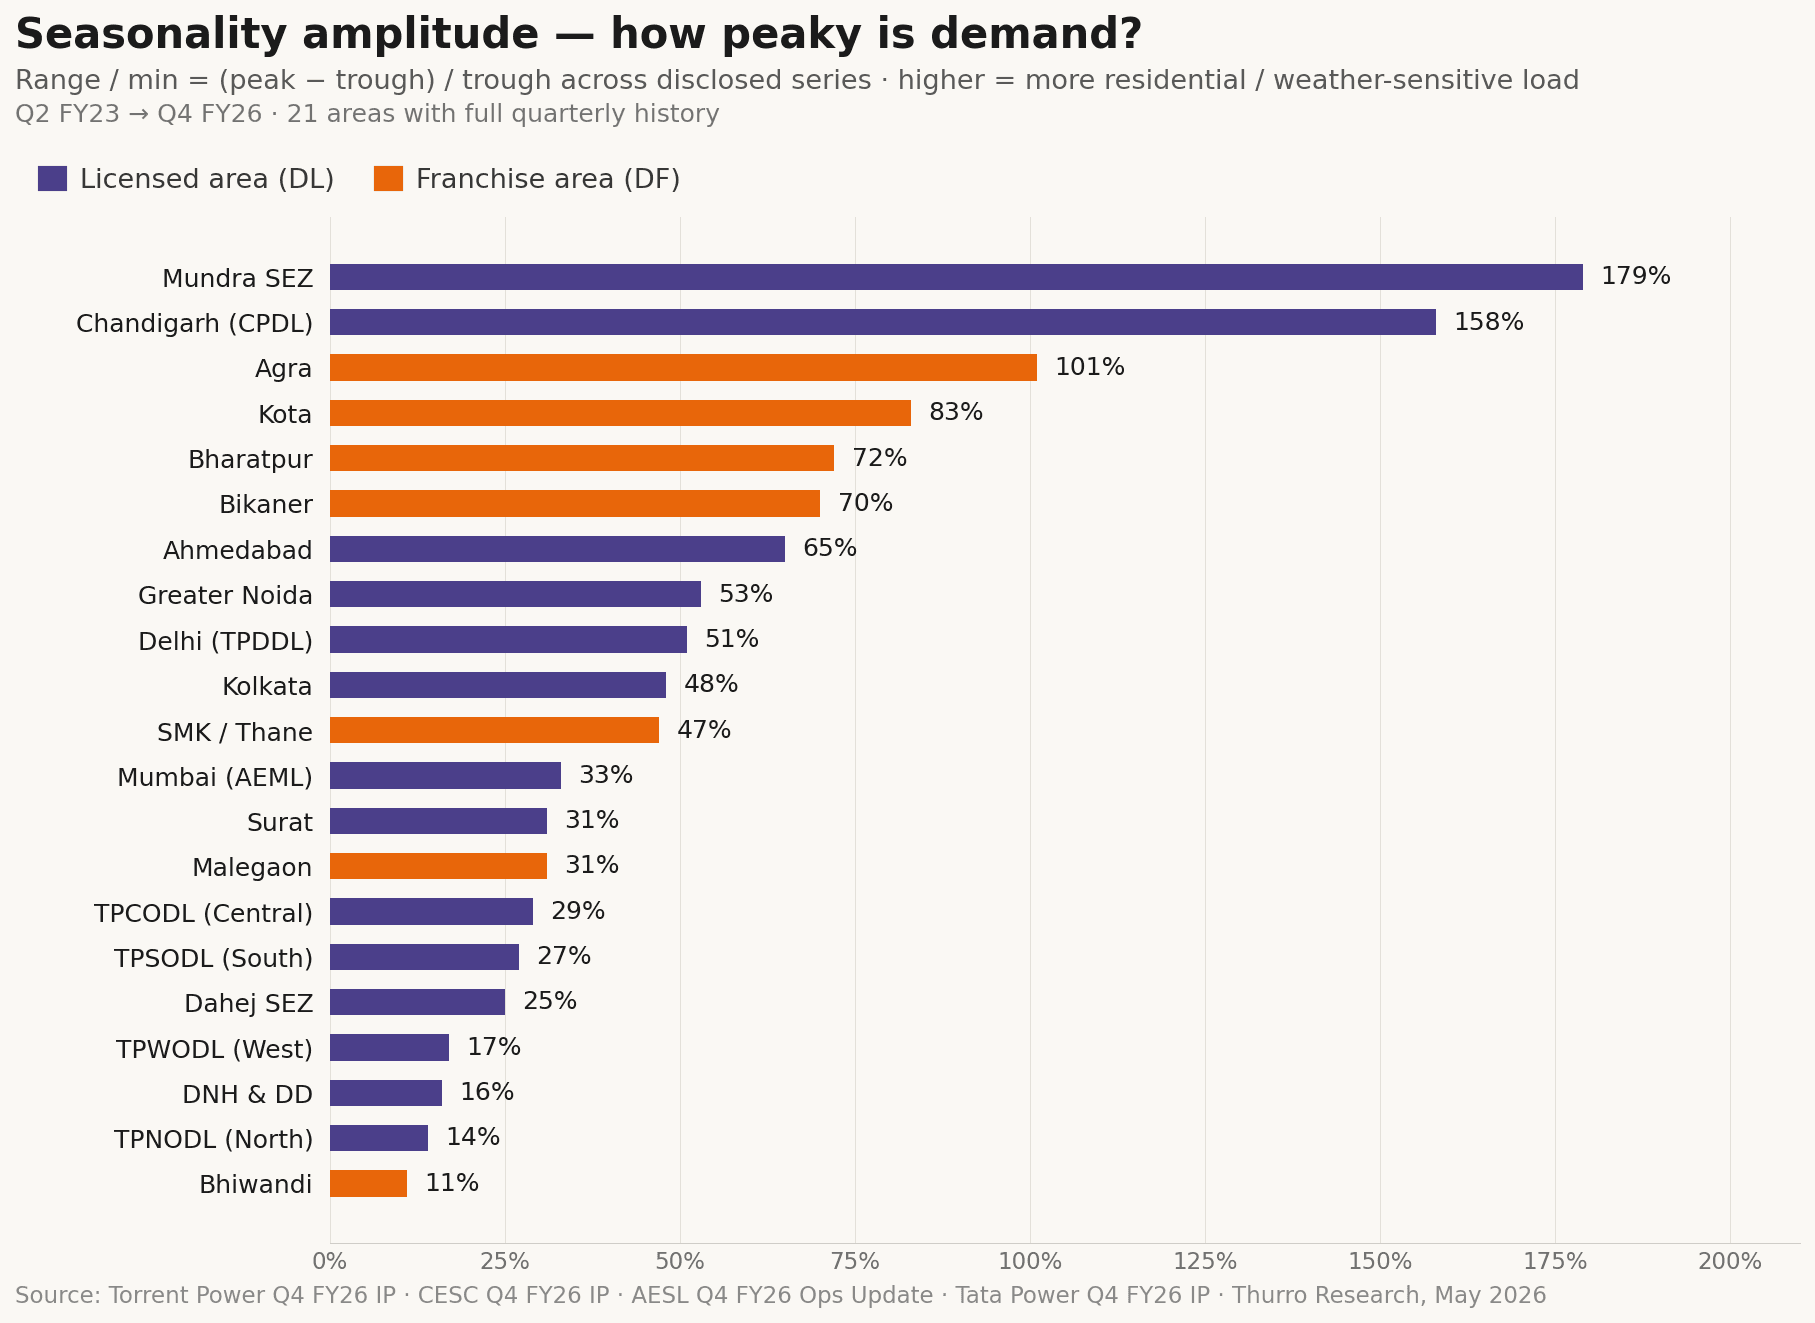
Residential and weather-sensitive areas typically printed sharper Q1–Q2 peaks followed by weaker Q3 demand, while industrial areas printed comparatively flatter quarterly consumption patterns.
The Mumbai metropolitan region illustrated one of the lowest-seasonality profiles in the dataset. Torrent Power’s Bhiwandi distribution franchise reported electricity consumption of 1,023 MU in Q4 FY26, up 2.8% year-on-year, while maintaining relatively limited quarterly variation across the disclosed period. By comparison, Ahmedabad displayed visibly larger quarterly swings, recording a seasonality amplitude of 65 versus 11 for Bhiwandi.
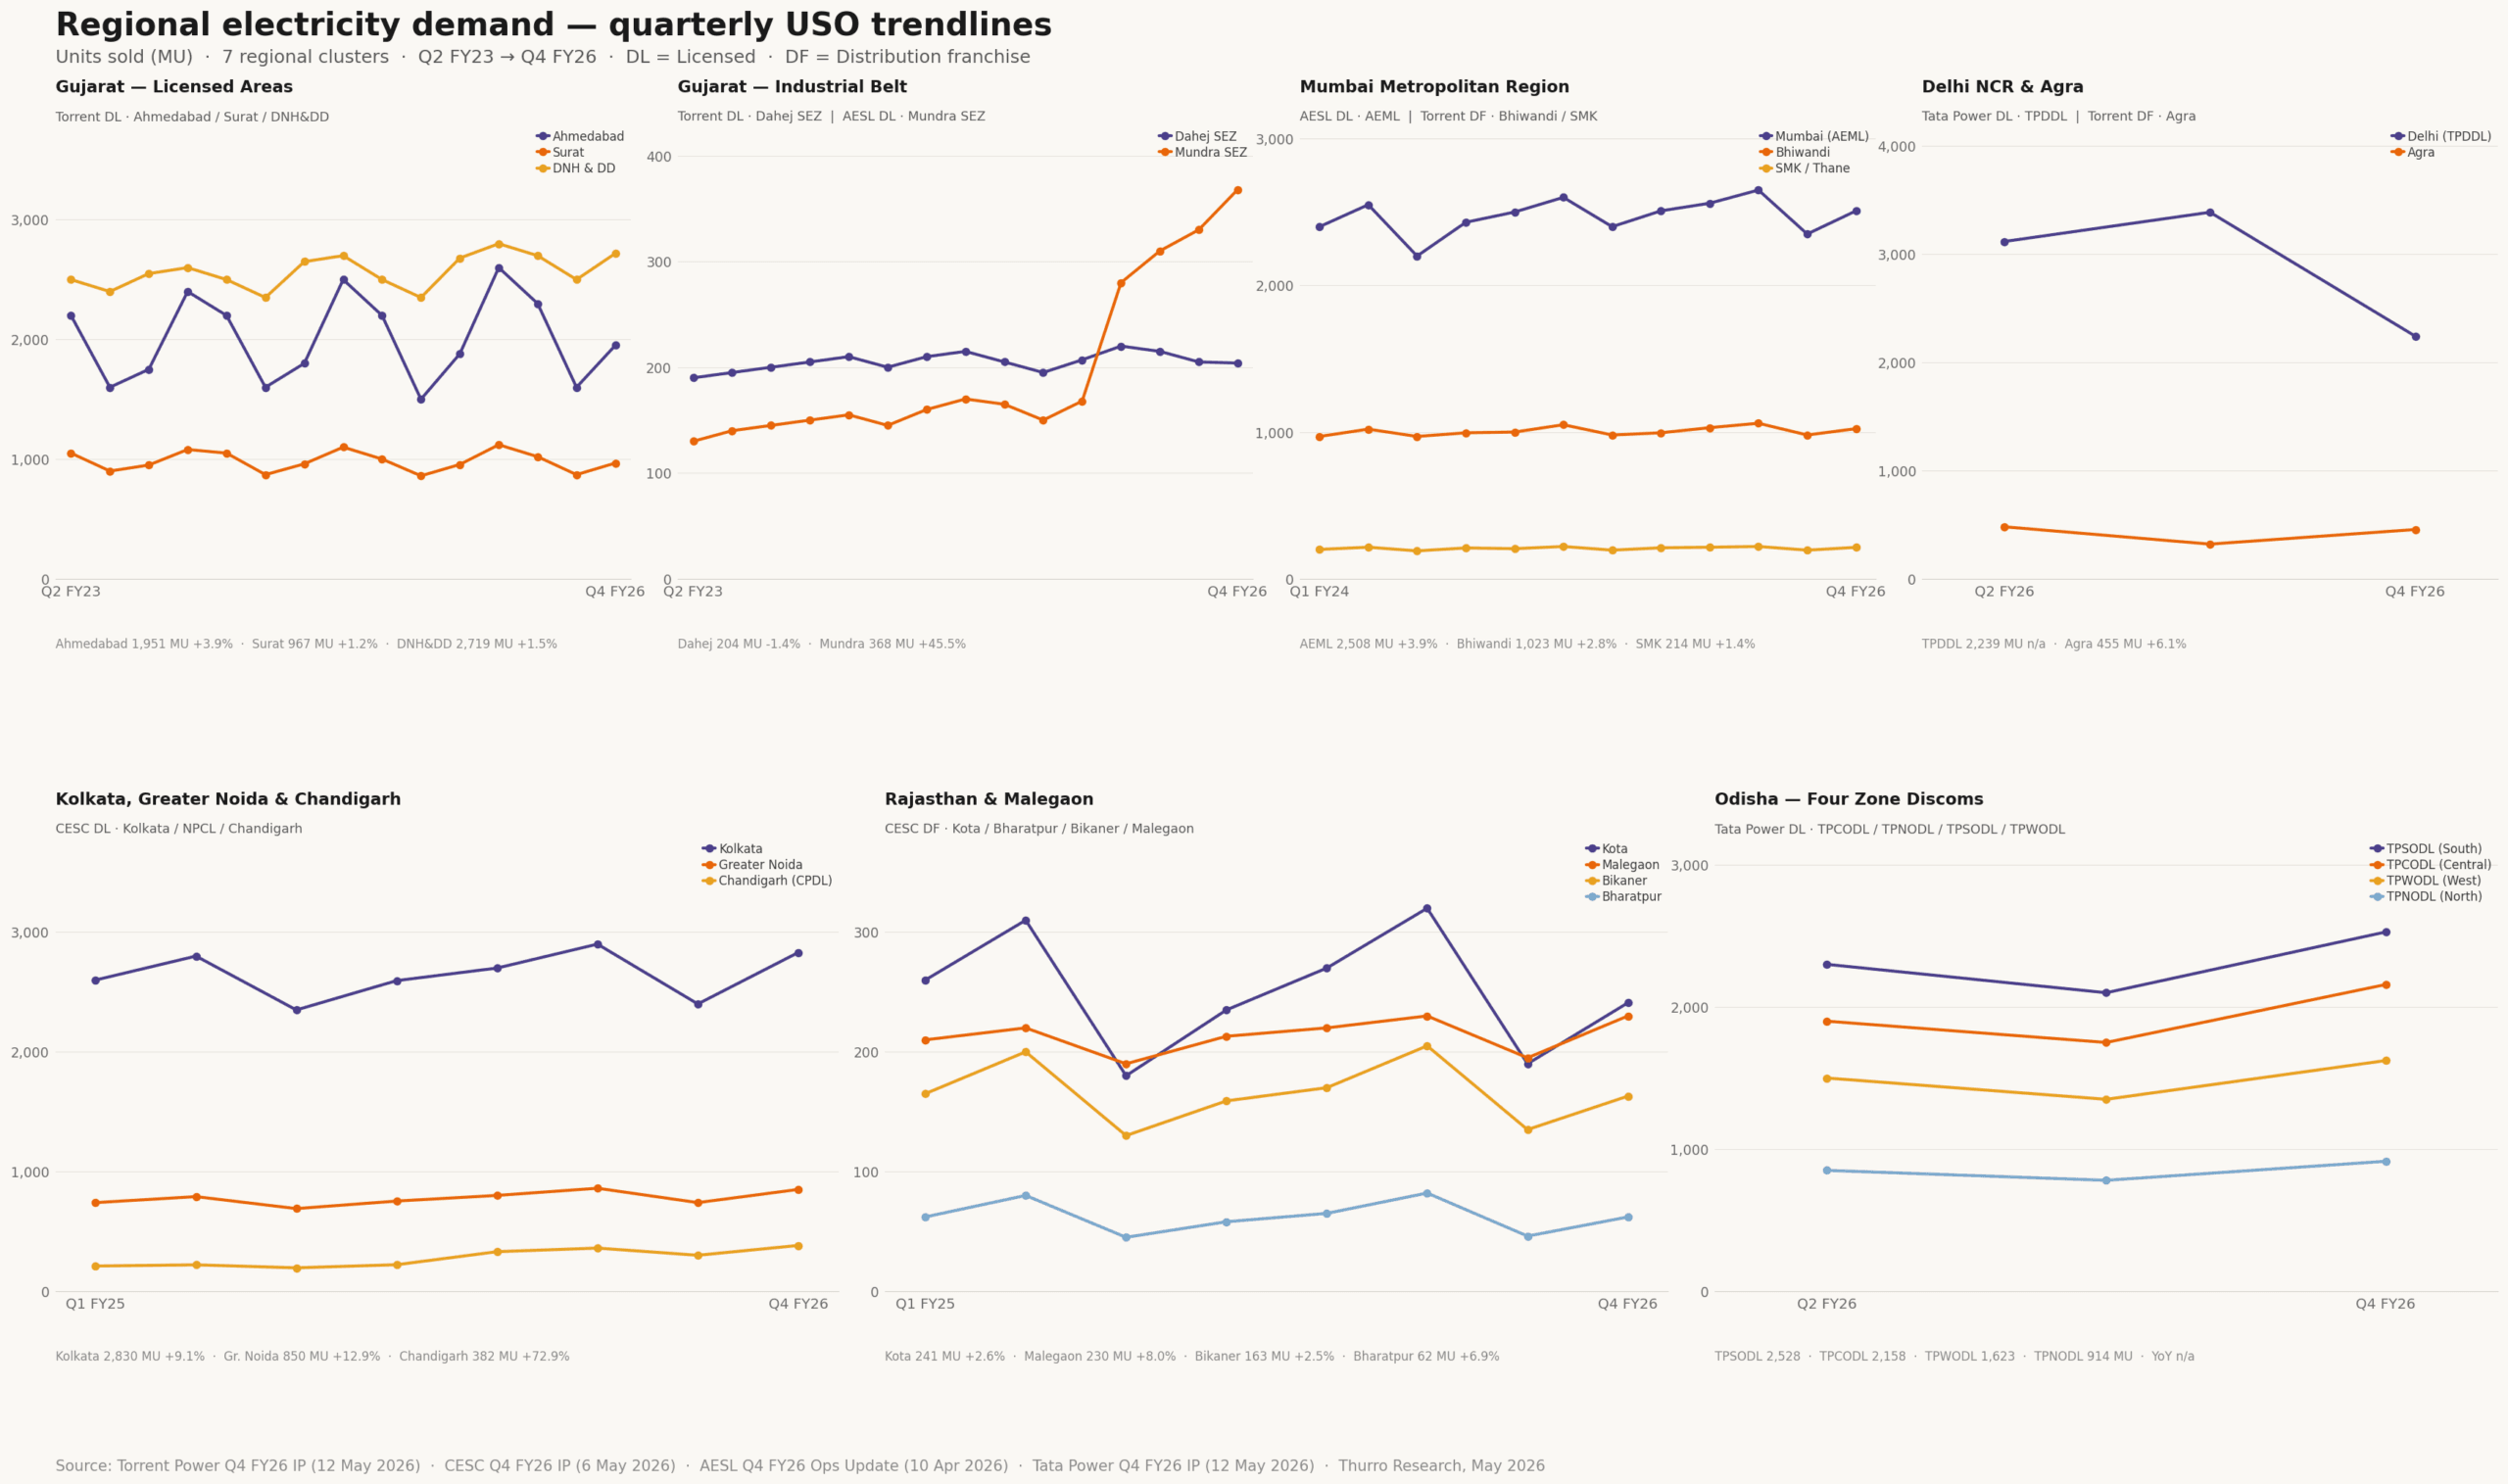
The Gujarat industrial belt showed materially different electricity-consumption trajectories across clusters. Mundra SEZ recorded electricity consumption of 368 MU in Q4 FY26, up 45.5% year-on-year, while Dahej SEZ reported 204 MU, down 1.4% year-on-year.
Urban demand centres also reported positive year-on-year growth within the disclosed dataset. Greater Noida reported electricity consumption growth of 12.9% year-on-year in Q4 FY26 to 850 MU, while Kolkata rose 9.1% to 2,830 MU over the same period.
The local electricity patterns also broadly overlapped with management commentary from cooling-equipment and commercial air-conditioning companies which have highlighted rising room-AC penetration, larger-capacity units, and sustained commercial-cooling demand.
Signals from companies
Voltas’s commentary was among the clearest signals that the room-AC market had entered FY27 with stronger underlying demand conditions after a weak FY2026 base. Speaking on the company’s May 14 earnings call—one day before the Ministry of Power highlighted record demand—Voltas chief financial officer K.V. Sridhar said:
“With the ongoing season, the company remains optimistic about demand trends across product categories, supported by improved consumer sentiment, increasing premiumization, rising urbanization and continued infrastructure investments.”
Managing director Mukundan Menon provided a more direct assessment of the room-AC market trajectory:
“The primary sales of all brands put together was 14.3 million units [in FY26]… projection for going forward, this will certainly expect it to grow at least 15% to 20% is what we feel because the last year base was a little weak… this year, we are seeing a good summer…”
FY2026 had been characterised by a weak summer and early monsoon conditions, leaving channel inventories lean going into FY2027. Menon also drew an explicit distinction between weather-sensitive residential AC demand and weather-insensitive commercial cooling demand:
“Commercial air conditioner is another category which has no relevance to the intensity of the summer. It’s purely a B2B business… A lot of manufacturing play is coming in where we are getting a lot of inquiries…”
Blue Star’s management commentary aligned closely with the timing visible in the grid data. In its Q4 FY2026 earnings press release on May 6, chairman and MD Vir S. Advani said:
“The onset of summer from mid-April 2026 has led to a steady pickup in consumer sales of Room ACs, indicating improving market momentum for FY27. The Electro-Mechanical Projects and Commercial Air Conditioning segments are expected to sustain their growth trajectory, supported by demand from the manufacturing and data centre sectors.”
Managing director B. Thiagarajan quantified the scale of this opportunity during its May 7 earnings call:
“To give you a rough idea that the data centre, the MEP part, where we are leaders, we would estimate the market size to be somewhere around Rs 3,500 crore and we do a business of around Rs 1,000 crore there. This is likely to more than double within 3 years, going by the inquiries in hand and going by the order finalization speed that is there. So therefore, the MEP part of that Rs 1,000 crore has the potential to go to Rs 3,000 crore within 3 years.”
The company added that around 15% of Blue Star’s revenue could already be linked to data-centre related mechanical, electrical, and plumbing (MEP) business alone.
In Havell’s Q4 FY2026 earnings call on April 22, chairman and MD Anil Rai Gupta said: “… After a delayed onset of the summer season, we are now seeing signs of pickup in demand for cooling products. We remain optimistic on a revival of summer demand while closely tracking El Niño and its impact on consumption.”
Beyond summer demand
Taken together, the grid data and management commentary point to a broader shift in India’s electricity-demand profile during May 2026.
The rise in peak demand coincided not only with elevated temperatures and cooling demand, but also with continued expansion in commercial cooling, logistics infrastructure, and data-centre activity referenced in company commentary and local electricity data.
The persistence of both solar-hour and non-solar-hour demand is particularly important because the elevated demand levels extended beyond isolated peak periods. Taken together, the grid data, local electricity patterns, and management commentary are consistent with a broader electricity-demand profile across the day rather than isolated evening demand spikes alone.
The analysis reflects company commentary and disclosures rather than an independent assessment of geopolitical developments.
Cover photo credit: AI generated image
View disclaimer
Unlock the power of alternative data
Do not just follow the market — stay ahead of it. Thurro helps you transform raw filings and alternative datasets into actionable insights.
Explore Thurro AltData Book a demoRelated Articles
Nine years of net gold buying equals nine years of current account deficit — and it has doubled in value
India paid out $286bn for net gold between FY18 and FY26. Its cumulative current account deficit over the…
The UPI MDR pool is about ₹1,000 crore a month, and two-thirds of it sits where nobody can see it
Parliament has cleared the way for merchant charges on UPI. The merchant-category data says the revenue is real…
India’s commodity trade is running on price, not volume
India's trade value is still climbing — imports up about 18 percent and exports about 8 percent in…