
- Customs value-and-quantity records let us split India’s trade into how much actually moved and what it cost — the question the headline value prints bury. We read it on the priceable commodity complex, where unit value (value divided by quantity) is a credible price
- Across that basket, CYTD26 import value rose about 4 percent on roughly 5 percent lower volume and 9 percent higher unit value; export value rose about 11 percent on roughly 8 percent lower volume and 24 percent higher unit value. On both sides, tonnage fell and price carried the gain
- Read trade strength with care: a rising import bill is terms of trade, not demand, and export growth is realisation, not share. The visible import surge sits in gold and electronics, not commodities — and the priceable slice is itself shrinking as commodities deflate

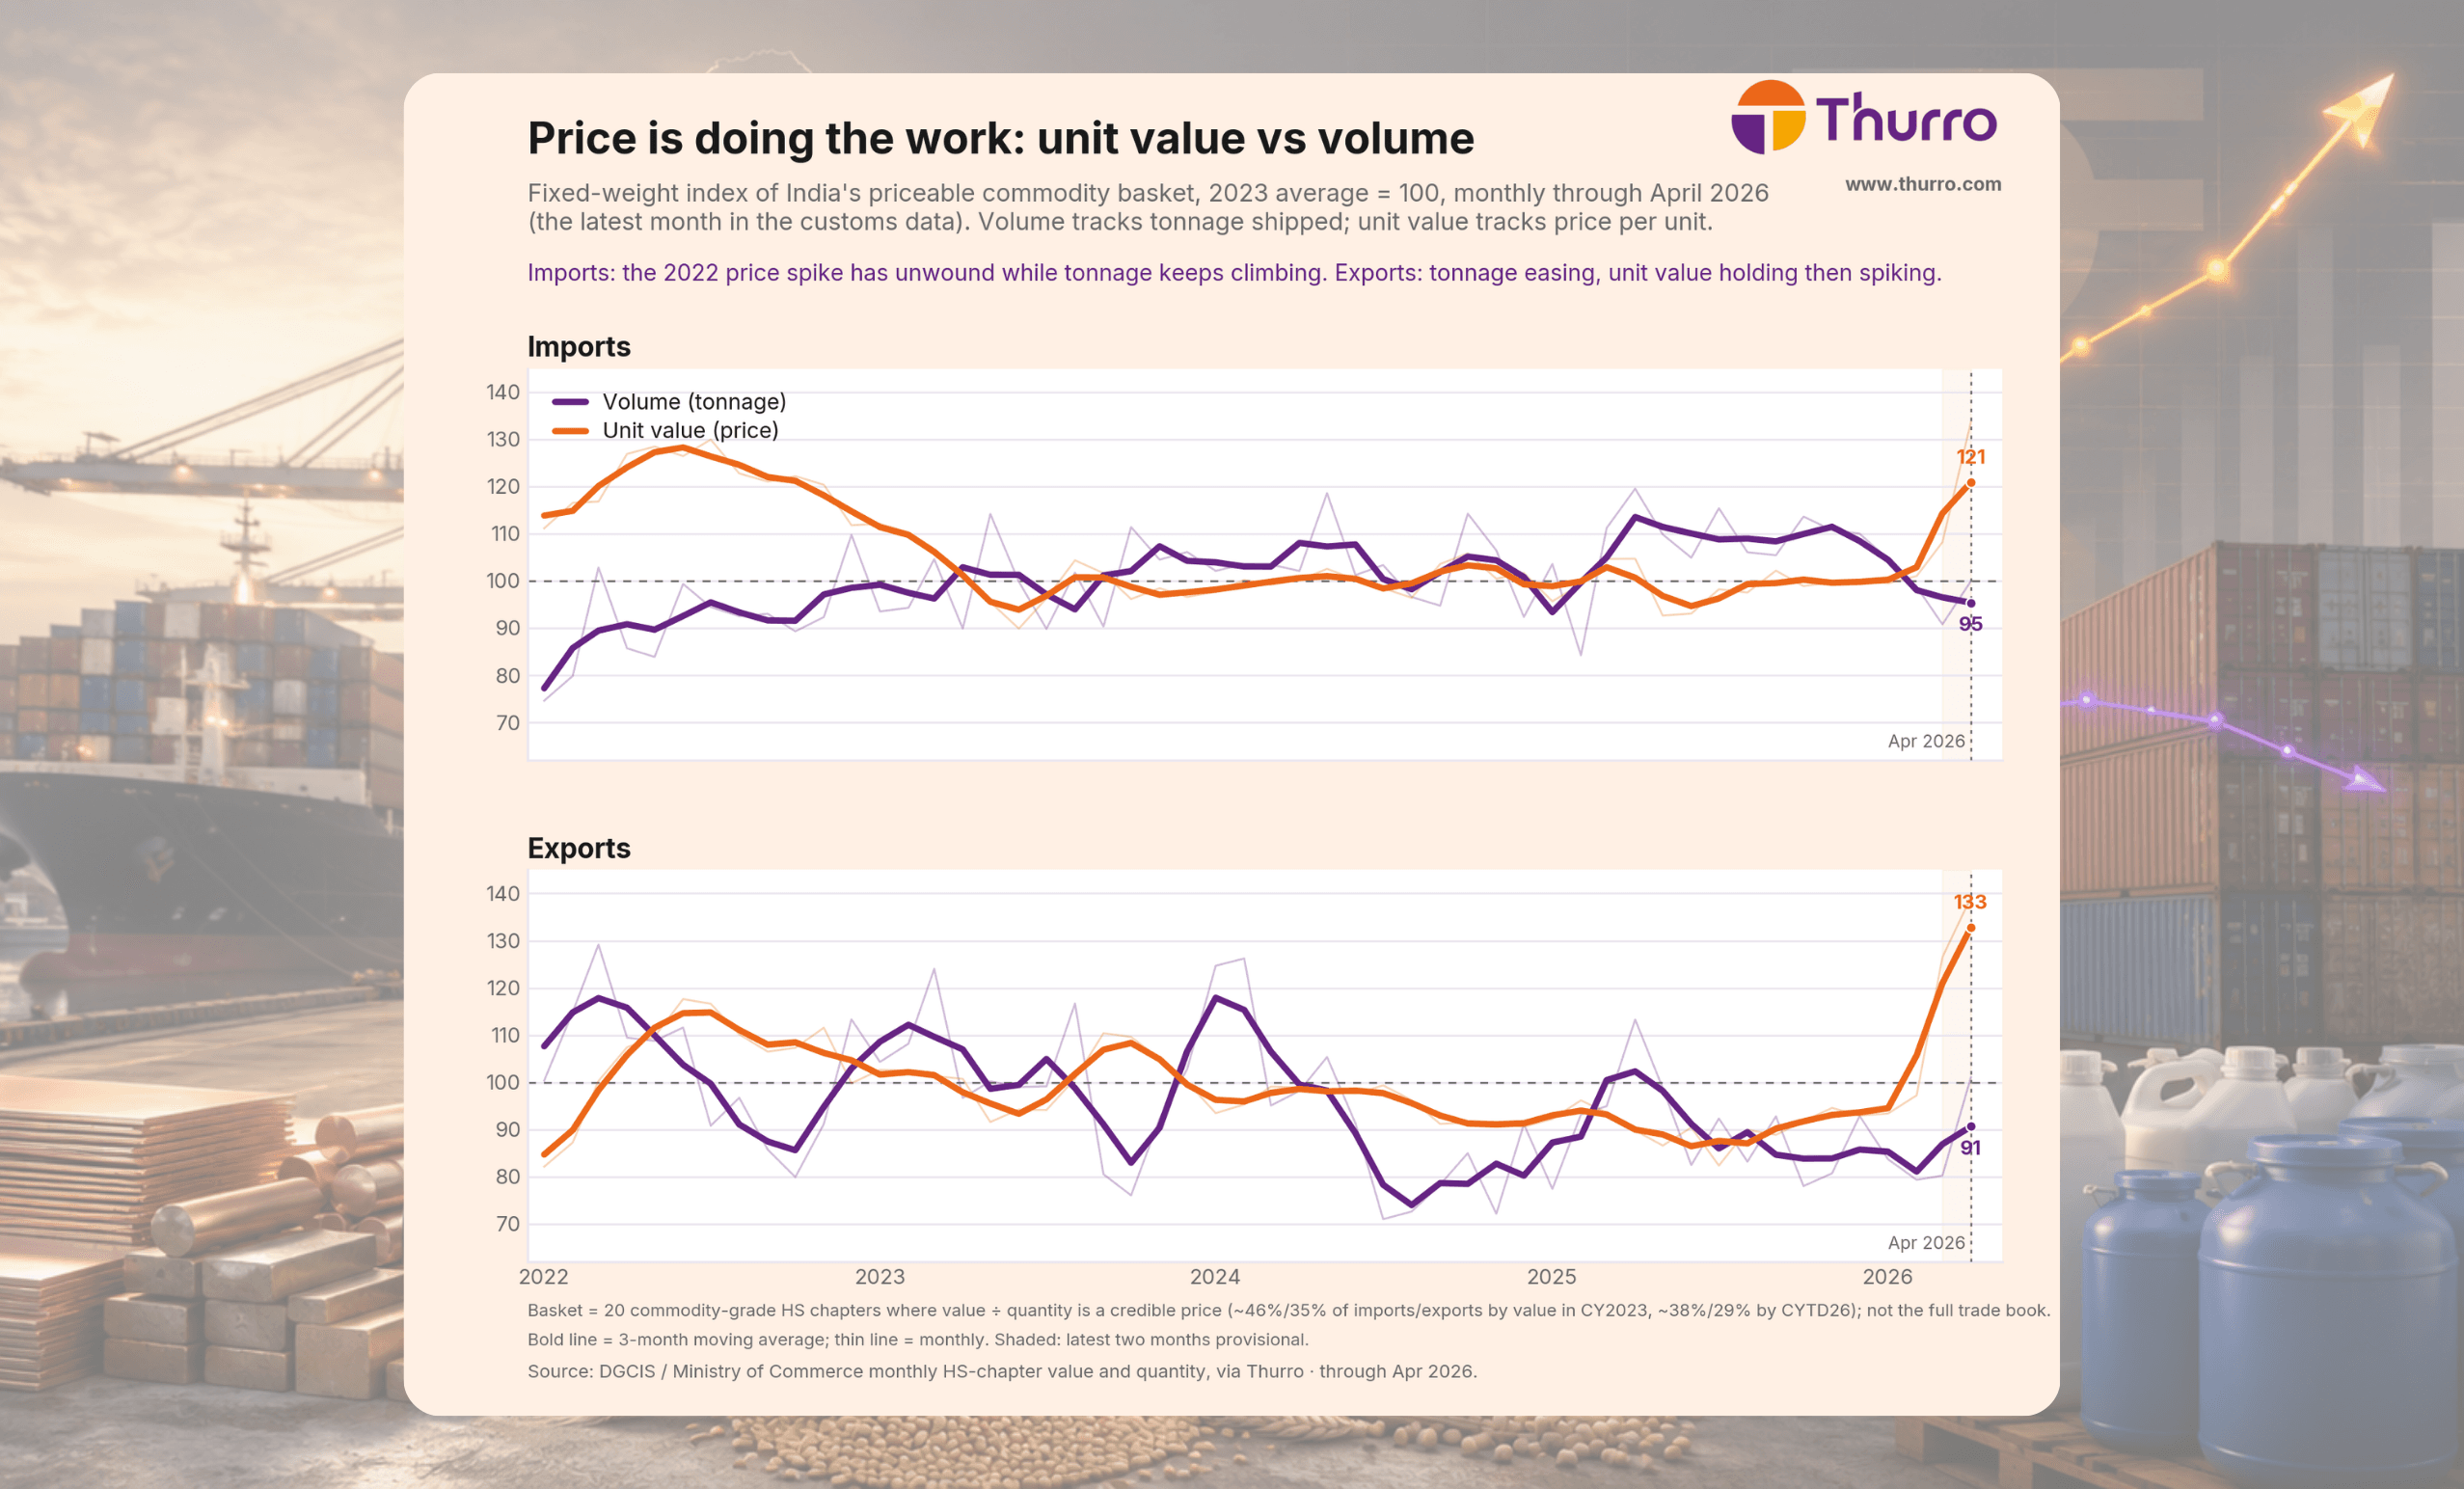
Fixed-weight index of the priceable commodity basket, CY2023 average = 100, monthly through April 2026. Imports buy more tonnage at unwound prices; exports ship less while unit value carries, then spikes.
Through April 2026 — the most recent month customs data covers — India’s merchandise import value is up about 18 percent year on year, at roughly ₹24.6 trillion, and exports about 8 percent, at ₹14.3 trillion (we call this window CYTD26, January to April). Taken at face value, that looks like firm import demand and competitive exports. But value is price times quantity, and right now the two halves point in opposite directions. On the goods where customs reports a quantity and the unit value is a genuine price — energy, metals, grains, fertiliser, polymers and the large single chemicals — we can separate them. Do that, and the volume side is negative on both flows. The growth is price.
The finding
Our commodity price-volume index, rebased to a normal year (CY2023 = 100) and run monthly to April 2026, tells the story in two panels. On imports, the 2022 commodity-price bulge — unit value sat at 115 to 130 — has fully unwound; through 2023 to 2025 unit value hovers near 100 while tonnage climbs into a 100-to-113 band. India has been buying more by quantity at normalised prices. On exports, it is the mirror image: tonnage eases out of the 110-to-125 range down into the 70s and 80s through 2024 and 2025, while unit value holds near 90 to 100 and then jumps to about 133 by April 2026 on a refined-fuel realisation surge.
The snapshot confirms the trend. Decomposed CYTD26 against CYTD25 on CY25 value weights, the priceable basket splits cleanly: import value +4% = volume −5% + price +9%, and export value +11% = volume −8% + price +24%. On both sides India shipped or bought less by quantity, and the entire value gain — and more — came from price. The headline says the opposite only because the biggest movers sit outside the priceable set: that +18 percent import-value print is gold and electronics, while the priceable oil bill actually fell about 4 percent (volume −11 percent, unit value +8 percent). Strip the un-priceable goods and India’s commodity trade is a price story wrapped around a shrinking-volume core. That is our variant view — what looks like trade momentum is, in the measurable commodity book, terms of trade and realisation, not more goods crossing the border.
How to read the index
Each panel is a single fixed-weight index of the priceable basket, set to 100 at its CY2023 average. The purple line is volume — the tonnage actually shipped, aggregated across the basket on fixed CY2023 value weights so that a change in mix cannot masquerade as a change in quantity. The orange line is unit value — total value divided by total quantity, the closest thing to a price we can read straight off customs records. We hold the weights fixed precisely so the gap between the two lines is the price effect and nothing else. The catch is that unit value is only a credible price for reasonably homogeneous goods — a tonne of copper, a litre of methanol — which is why the basket stops at energy, metals, grains, fertiliser, polymers and single chemicals, and never tries to price a smartphone or a turbine. The series runs monthly to April 2026, the latest month customs publishes; we shade the final two months because they still revise.
Is it just oil, or one or two lines?
No — the imports scatter shows the price lift is broad. Feedstocks and metals carry it: copper unit value +32 percent, tin +56 percent, nickel +37 percent, ammonia +57 percent, phosphoric acid +29 percent, p-xylene +19 percent, methanol +17 percent — most of them on flat-to-lower volume. The volume-led names are the commodity resins (polypropylene volume +31 percent at −4 percent price, PTA +14 percent at +7 percent). Oil, the single largest line, fell on both axes. Breadth across chapters and chemicals — not a single chapter — makes the price read.

Imports, CYTD26 vs CYTD25: price growth versus volume growth by commodity-grade chapter and large single chemical.
Is the export price just a refining quirk?
Partly, but not only. Petroleum is the swing — volume −20 percent, unit value +40 percent — and it dominates the export book. But coffee, tea and spices show the very same shape (price +30 percent on volume −27 percent), and aluminium earned +22 percent more per tonne. The one genuinely volume-led export is steel (+25 percent volume, −3 percent price). And note what is absent: India’s big chemical exports are agrochem and pharma formulations — blends with no clean unit price — so only alumina (volume +70 percent, price −37 percent) and benzene survive as single-chemical points. That sparsity is itself a read on the export mix.

Exports, CYTD26 vs CYTD25: petroleum, coffee and aluminium earn more per unit on lower or flat volume; only steel is volume-led.
Is this representative?
Honestly, no — and that is the point we make openly. The priceable basket is about 38 percent of imports and 29 percent of exports by value in CYTD26, down from about 46 percent and 35 percent in CY2023. It shrank for the same reason the index shows: commodities deflated from the 2022 peak, and the volume growth in India’s trade migrated to exactly the goods we exclude — electronics and machinery. So we scope the claim to the commodity complex, where the price-versus-volume question is answerable, and read the rest of the book with the same caution rather than pretending unit value means anything for a smartphone.

The priceable basket as a share of total merchandise value, CY2023 versus CYTD26, by flow.
Core merchandise exports continued to grow strongly by 7.2 per cent, mainly driven by electronic goods… Petroleum products exports fell starkly by 15.6 per cent. Similarly… the petroleum, crude and products imports fell by 4.4 per cent, likely attributable to the softening of the average Crude Oil FOB Price (Indian Basket).
— Department of Economic Affairs, Ministry of Finance — Monthly Economic Review, June 2025
What to watch
The number that decides whether export value growth survives the year is the unit-value spike at the right edge of the index. The March-to-April jump to about 133 is refined-fuel realisation, and the last two months are provisional. If product cracks normalise as new refining capacity ramps — Reliance and the state refiners both flag weaker FY26 cracks — the price leg fades, and with export tonnage already down about 8 percent, headline export value stalls. On imports, watch whether the commodity volume strength holds as prices stay soft, and whether gold keeps flattering the bill. Strip the price effect out and India’s commodity trade is barely growing — that, not the headline value print, is the signal worth acting on.
A more detailed version of this analysis, including underlying datasets and extended breakdowns, is available to clients on request. For access, please write to contact@thurro.com.
Cover photo credit: AI generated image
View disclaimer
Unlock the power of alternative data
Do not just follow the market — stay ahead of it. Thurro helps you transform raw filings and alternative datasets into actionable insights.
Explore Thurro AltData Book a demoRelated Articles

India’s net FDI has all but vanished — even as foreign money keeps pouring in
FY26 balance-of-payments data is in: gross inflows hit a record, yet net FDI is barely above zero. What's…

India’s nuclear push is creating a scarcity premium for certified suppliers
India’s thorium strategy and fast breeder reactor progress could reshape the economics of India’s nuclear manufacturing ecosystem

How Indian companies navigated the 2026 gas disruption
Companies across chemicals, fertilisers, and ceramics are now reporting curtailed allocations, suspended production lines, and emergency fuel rationing