
- Combining RBI balance-of-payments and DPIIT data, we can decompose India’s FDI into what arrives and in what form, what foreign investors take back out, and where Indian firms now invest abroad — a far richer read than the headline net number
- Gross inflows reached a record USD 94.5bn in FY26, equity the bulk at USD 62bn, yet net FDI was just USD 7.7bn (and under USD 1bn in FY25), because repatriation rose to USD 54bn and Indian outbound FDI to USD 33bn
- The drag is structural, not waning interest: outbound FDI and repatriation now routinely cancel most of a record gross inflow, which shifts the financing of India’s current account deficit toward more fickle portfolio and debt flows

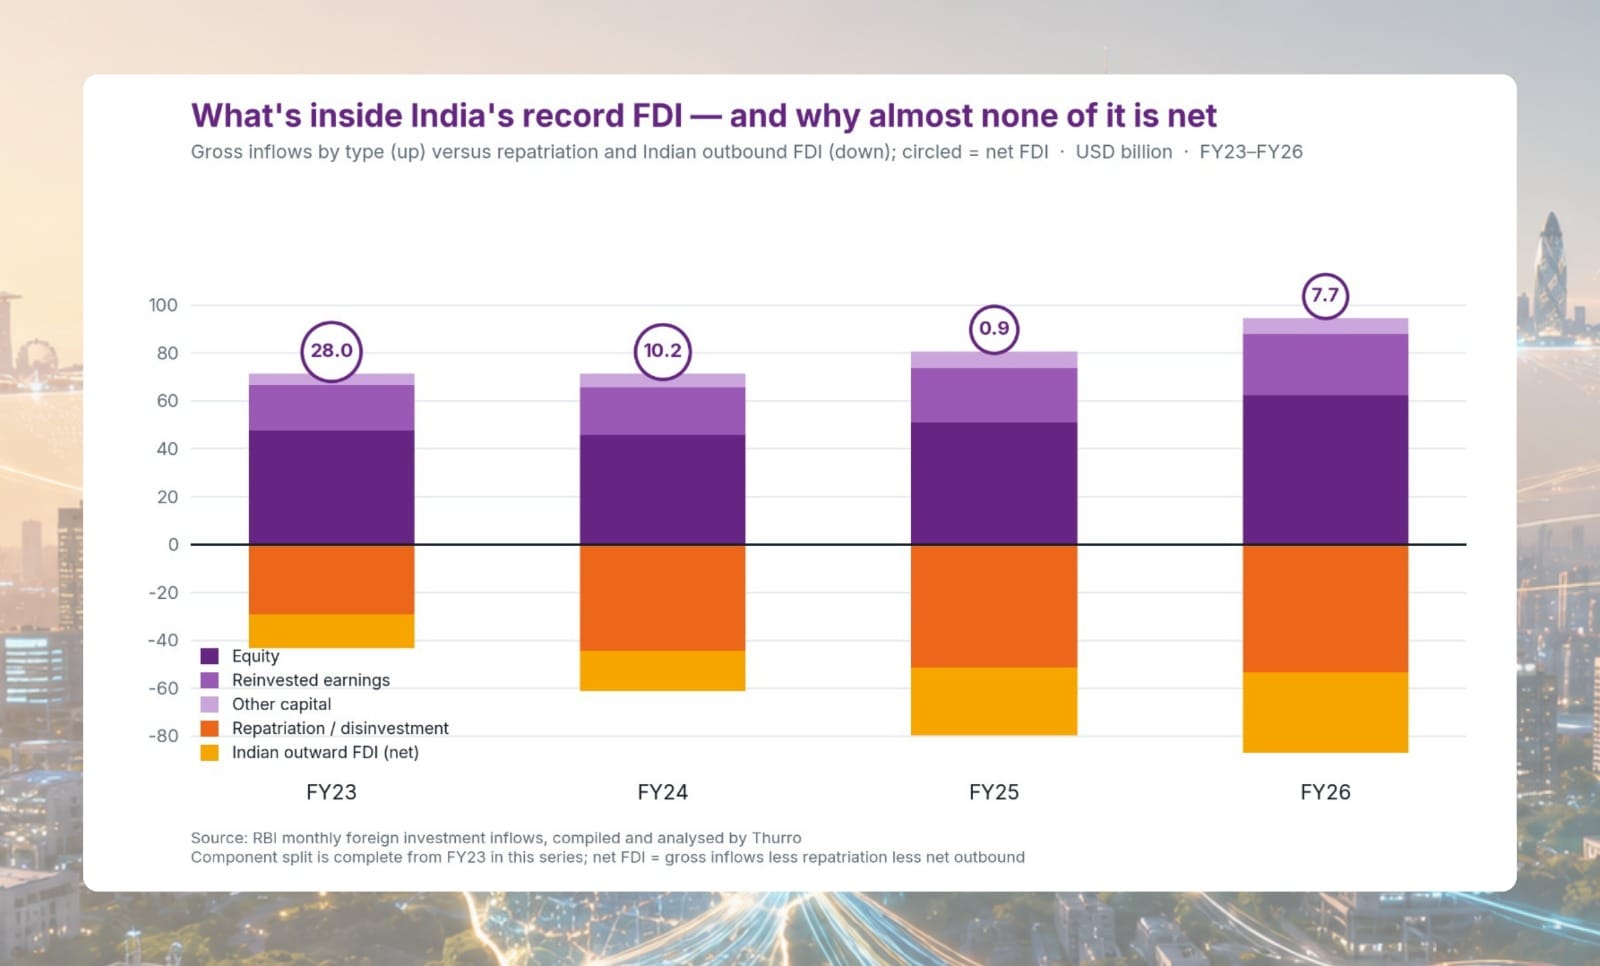
Gross inflows, split into equity, reinvested earnings and other capital, climb to a record; below the line sit repatriation and Indian outbound FDI. The circled figure is net FDI — USD 28bn in FY23, just USD 0.9bn in FY25, USD 7.7bn in FY26.
The headline writes itself every quarter: net foreign direct investment into India has collapsed. In FY25 it came in under a billion dollars, down from more than USD 40bn only four years earlier. The natural reading is that India has lost its shine — that capital is voting with its feet amid global fragmentation and a harder line on inbound money. The balance-of-payments data says something more interesting, and in part more reassuring. Gross inflows have never been higher. What has changed is not how much foreign capital arrives, but how much leaves — and how much Indian capital now goes the other way.
The finding
Net FDI is a small difference between three large flows, and the hero chart sets all of them on one axis. Above the line are the gross inflows, split into their parts: equity, the engine, has grown to a record USD 62bn in FY26; reinvested earnings add another USD 26bn; other capital the rest. Total gross inflows reached USD 94.5bn, the highest on record. This is not a country going off foreign capital.
Below the line are the two outflows that do the netting. Foreign investors repatriated or disinvested USD 54bn in FY26, and Indian firms invested a net USD 33bn abroad. The circled figure on each bar is what survives — net FDI: USD 28bn in FY23, USD 10bn in FY24, just USD 0.9bn in FY25, and USD 7.7bn in FY26. The inflow engine is running harder than ever; the netting is being done by exits and by Indian outbound ambition.
That distinction is the whole point. “Net FDI near zero” sounds like a financing crisis or a confidence shock. The components say otherwise. And the change is not cyclical: net FDI held a USD 30bn to USD 44bn band right through FY13 to FY22 before the three-year slide. A decade ago, FDI into India was effectively a one-way street; today the account is open in both directions, and the supporting charts show what that means in form, in source, and in destination.

Repatriation by foreign investors and net Indian outbound FDI, FY13–FY26 — both have roughly doubled since FY22.
The first objection is that this is a one-year freak. It is not. The two outflows that drain the net figure are old line items that have grown up: repatriation has nearly doubled since FY22 to USD 54bn as foreign investors book gains and exit cleanly, and net outbound FDI has roughly doubled to USD 33bn. Over the full decade both grind steadily higher — the recent hero sits on top of this structural rise, it does not create it.
The same two-way test applies by sector, and on the basis RBI reports it the split is sharp. Inbound is concentrated in everything tied to India’s domestic market — services and IT above all, then construction, energy and trade, each a clear net inflow. Two sectors lean the other way. Manufacturing tips net-outward once the full commitment is counted: Indian firms’ overseas commitments to build and buy factories now run ahead of inbound manufacturing FDI. And agriculture and mining is the firmly outward, resource-seeking leg — Indian capital buying the oil, gas and minerals the country is short of, with almost nothing coming the other way.

Inbound (DPIIT equity sectors, up) versus outbound (RBI activity, total financial commitment, down), mapped to six common buckets, FY16–FY26, with cumulative net circled. The bases differ, so read the net as directional.
This chart needs reading with more care than the others, because the two sides do not share a measuring stick. Inbound is DPIIT’s equity-route data, classified by product industry — computer software, pharmaceuticals, automobiles. Outbound is the RBI’s overseas-investment data, classified by broad economic activity — manufacturing, financial and business services, electricity. There is no common key the way a country name joins the geography chart, so we map both into six coarse buckets that only roughly correspond, and the net figures should be read as directional, not exact.
Three seams matter most. First, India’s outbound software and consulting investment is booked under financial and business services, not under a software heading, so the services bucket is not quite comparing the same activity on each side. Second, DPIIT does not separately track agriculture and mining inflows, so that panel’s inbound is understated and its net outflow correspondingly overstated — the direction is reliable, the magnitude soft. Third, a couple of months of outbound were missing for some buckets and have been interpolated. And one basis point underpins the whole picture: outbound here is RBI’s full financial commitment as reported — equity, loan and guarantees issued — which is precisely what tips manufacturing and resources net-outward. A guarantee is a contingent promise rather than cash that has left the country, but it is part of the headline overseas-investment number, so we keep it in to stay consistent with the official series. That also means this outbound is the commitment measure, not the balance-of-payments outflow in the opening chart; the two are built differently and are not meant to reconcile.

Inbound (DPIIT equity inflows, up) versus outbound (RBI financial commitments including guarantees, down) by partner, FY16–FY26, with cumulative net circled. This is RBI’s as-reported commitment basis.
The third lens is geography, and here a reporting choice matters. RBI publishes outward investment on its financial-commitment basis — equity, loan and guarantees issued — so to reconcile with the official numbers we keep guarantees in, even though a guarantee is a promise to pay rather than money that has actually left the country. On that as-reported basis, India is still a net recipient from most major partners over FY16–FY26, heavily so from Singapore, Mauritius, the US and the Netherlands, and from the conduit centres of Cayman and Cyprus. Three partners tip the other way: India is a net investor abroad with the United Kingdom, by about USD 10bn cumulatively, and marginally with the UAE, while GIFT City — India’s own offshore centre — absorbs outbound commitments and books no inbound at all. The same hubs carry money in both directions; only the balance differs.
This moderation is on account of a rise in repatriation and net outward FDI while gross FDI actually increased by 14 per cent. Rise in repatriation is a sign of a mature market where foreign investors can enter and exit smoothly, while high gross FDI indicates that India continues to remain an attractive investment destination.
— Reserve Bank of India, Governor’s monetary policy statement, 6 June 2025
The RBI’s reading is broadly right, and the data supports it — with one caveat it leaves unsaid. A market deep enough to let investors exit smoothly is a feature, not a flaw. But repatriation and outbound FDI carry opposite signals, and netting them into one sanguine line blurs the distinction worth watching.
What to watch
Watch the split, because the two drains point different ways. Repatriation rising is, as the RBI argues, partly a maturity story — a market deep enough to exit cleanly. Record outbound FDI is something else: Indian firms choosing to build abroad, and that will not reverse on a rate cut. The number to track is whether net FDI stabilises near USD 7–10bn or slides again in FY27’s first prints. If gross inflows stay at record levels while net keeps falling, the financing of India’s current-account deficit leans harder on portfolio flows and external borrowing — a more fickle base than the patient capital FDI is supposed to be.
A more detailed version of this analysis, including underlying datasets and extended breakdowns, is available to clients on request. For access, please write to contact@thurro.com.
Cover photo credit: AI generated image
View disclaimer
Unlock the power of alternative data
Do not just follow the market — stay ahead of it. Thurro helps you transform raw filings and alternative datasets into actionable insights.
Explore Thurro AltData Book a demoRelated Articles

India’s nuclear push is creating a scarcity premium for certified suppliers
India’s thorium strategy and fast breeder reactor progress could reshape the economics of India’s nuclear manufacturing ecosystem

How Indian companies navigated the 2026 gas disruption
Companies across chemicals, fertilisers, and ceramics are now reporting curtailed allocations, suspended production lines, and emergency fuel rationing

India’s power demand surge is no longer just a summer story
Electricity consumption data and company commentary suggest India’s summer power demand is becoming structurally broader than residential cooling…