

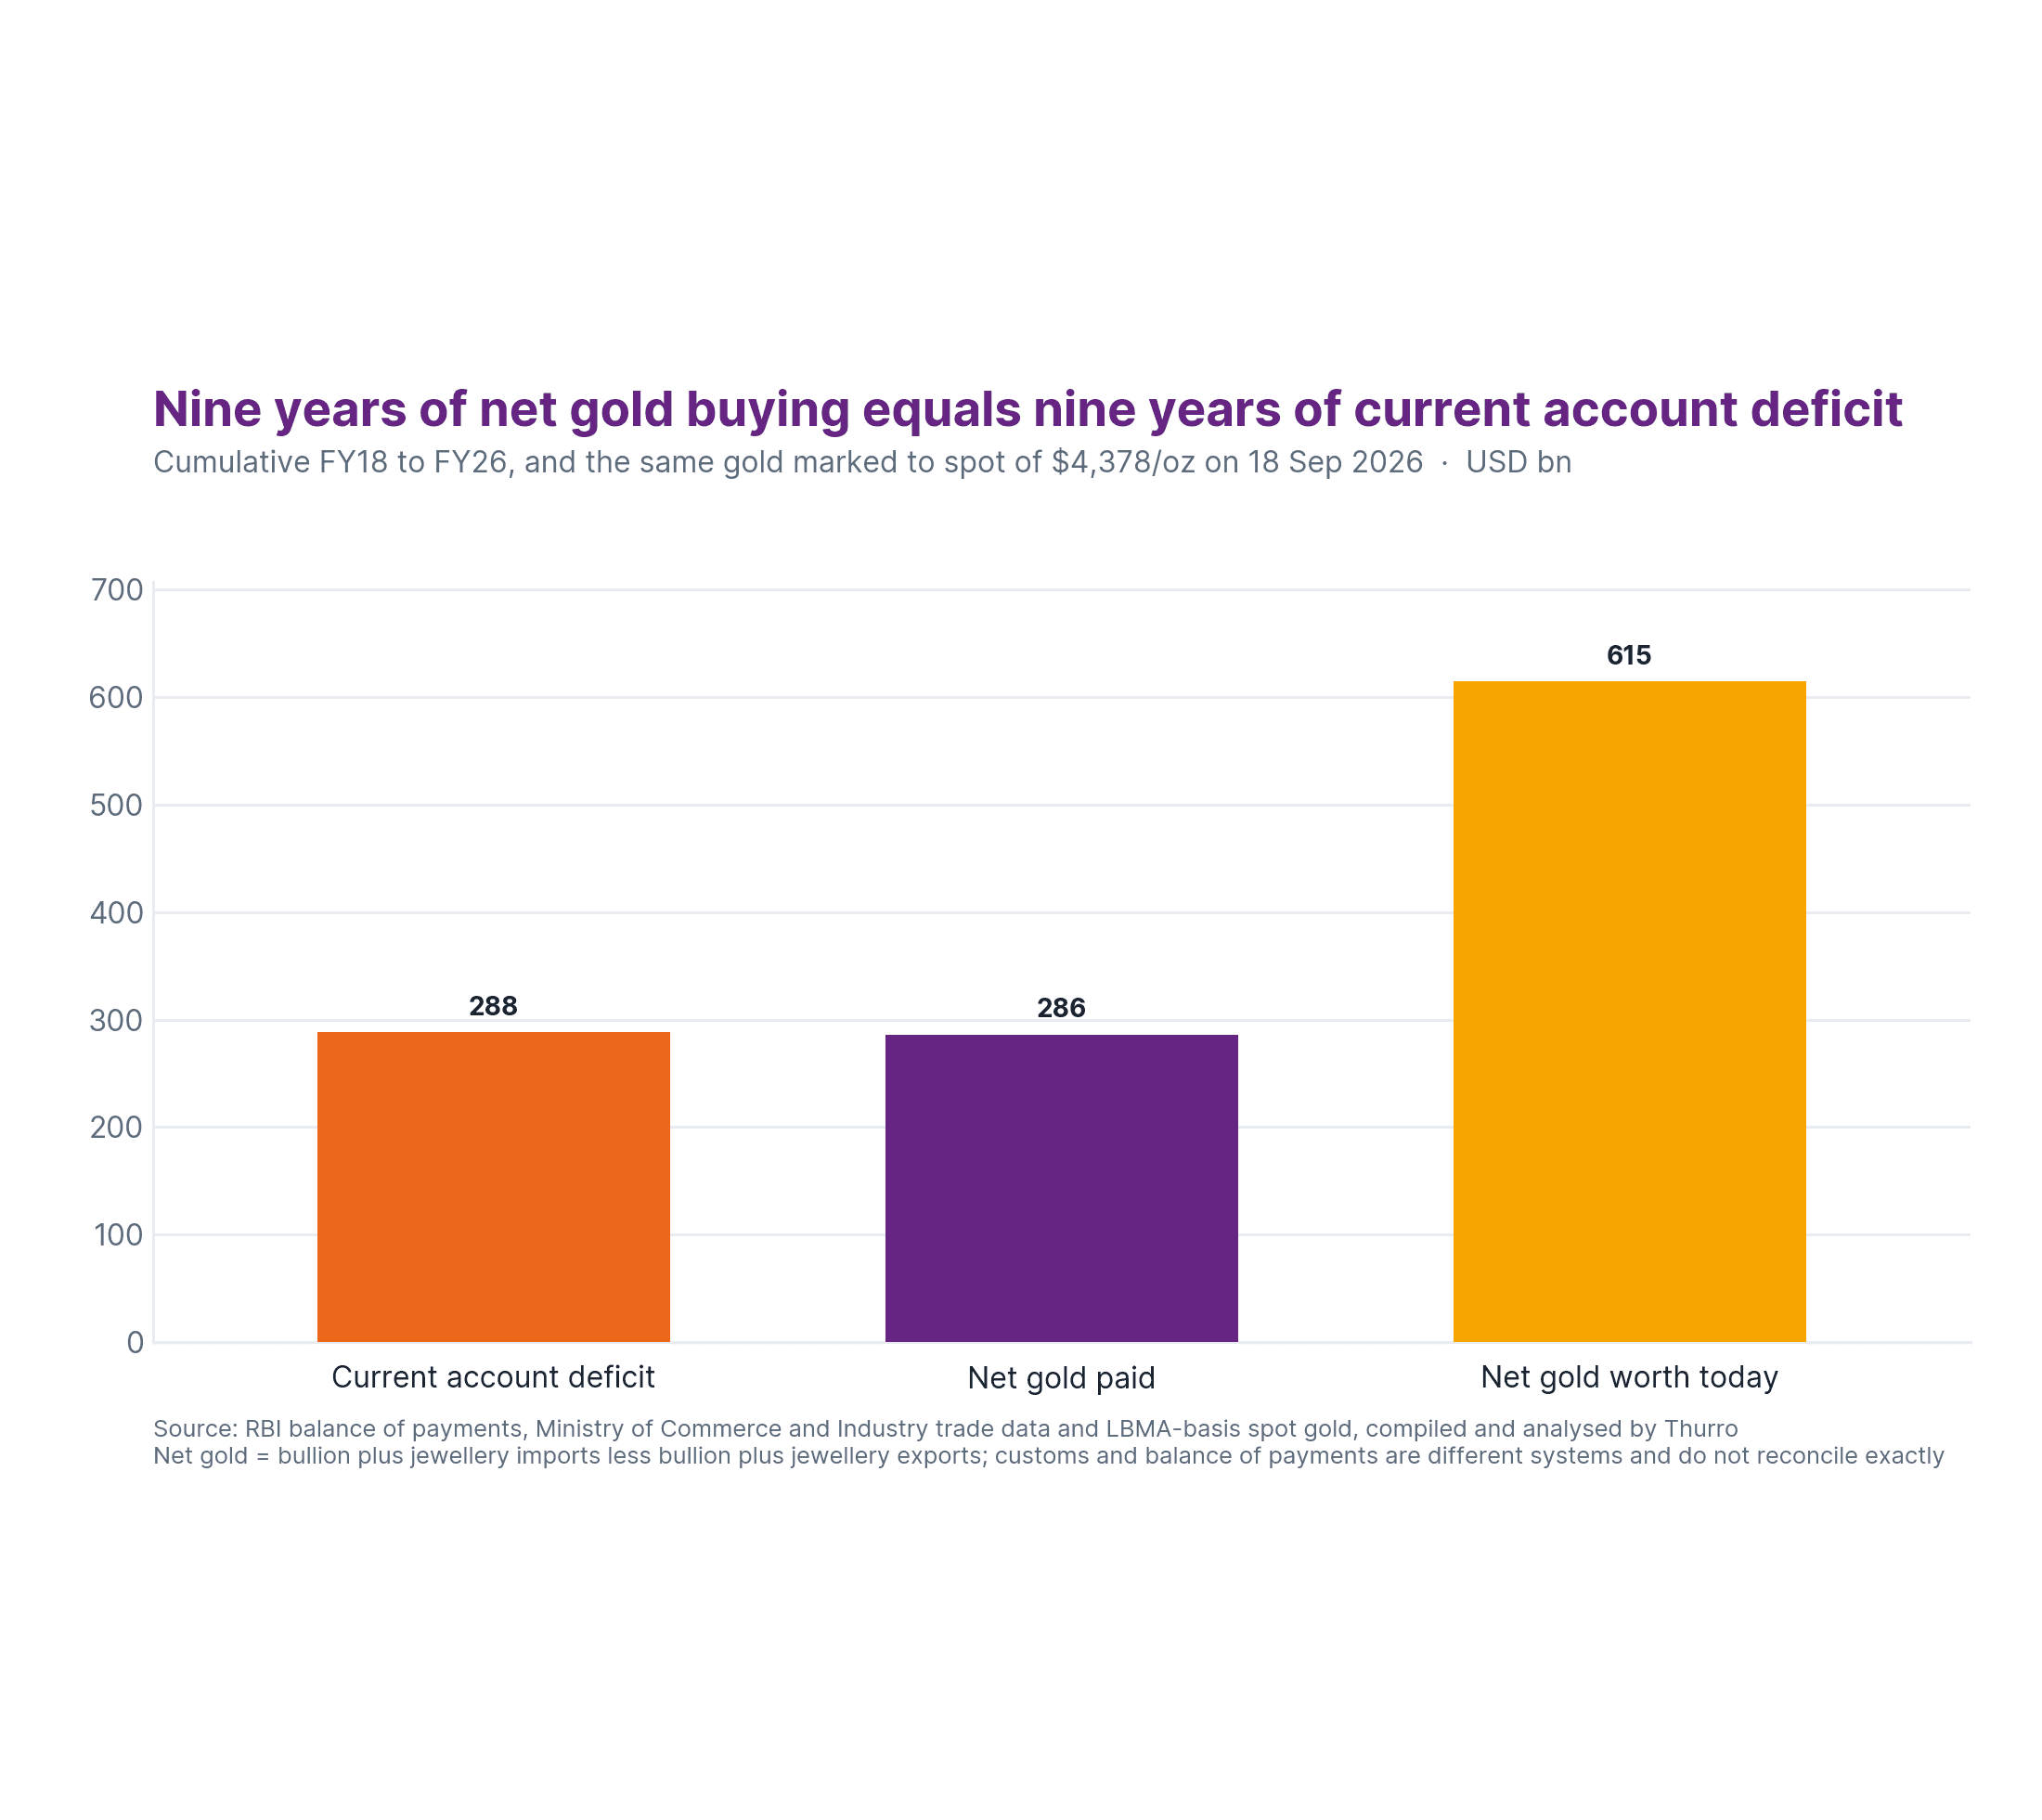

- We combine customs trade data with daily spot gold to size what nine years of net gold imports cost India, and what the metal is worth now.
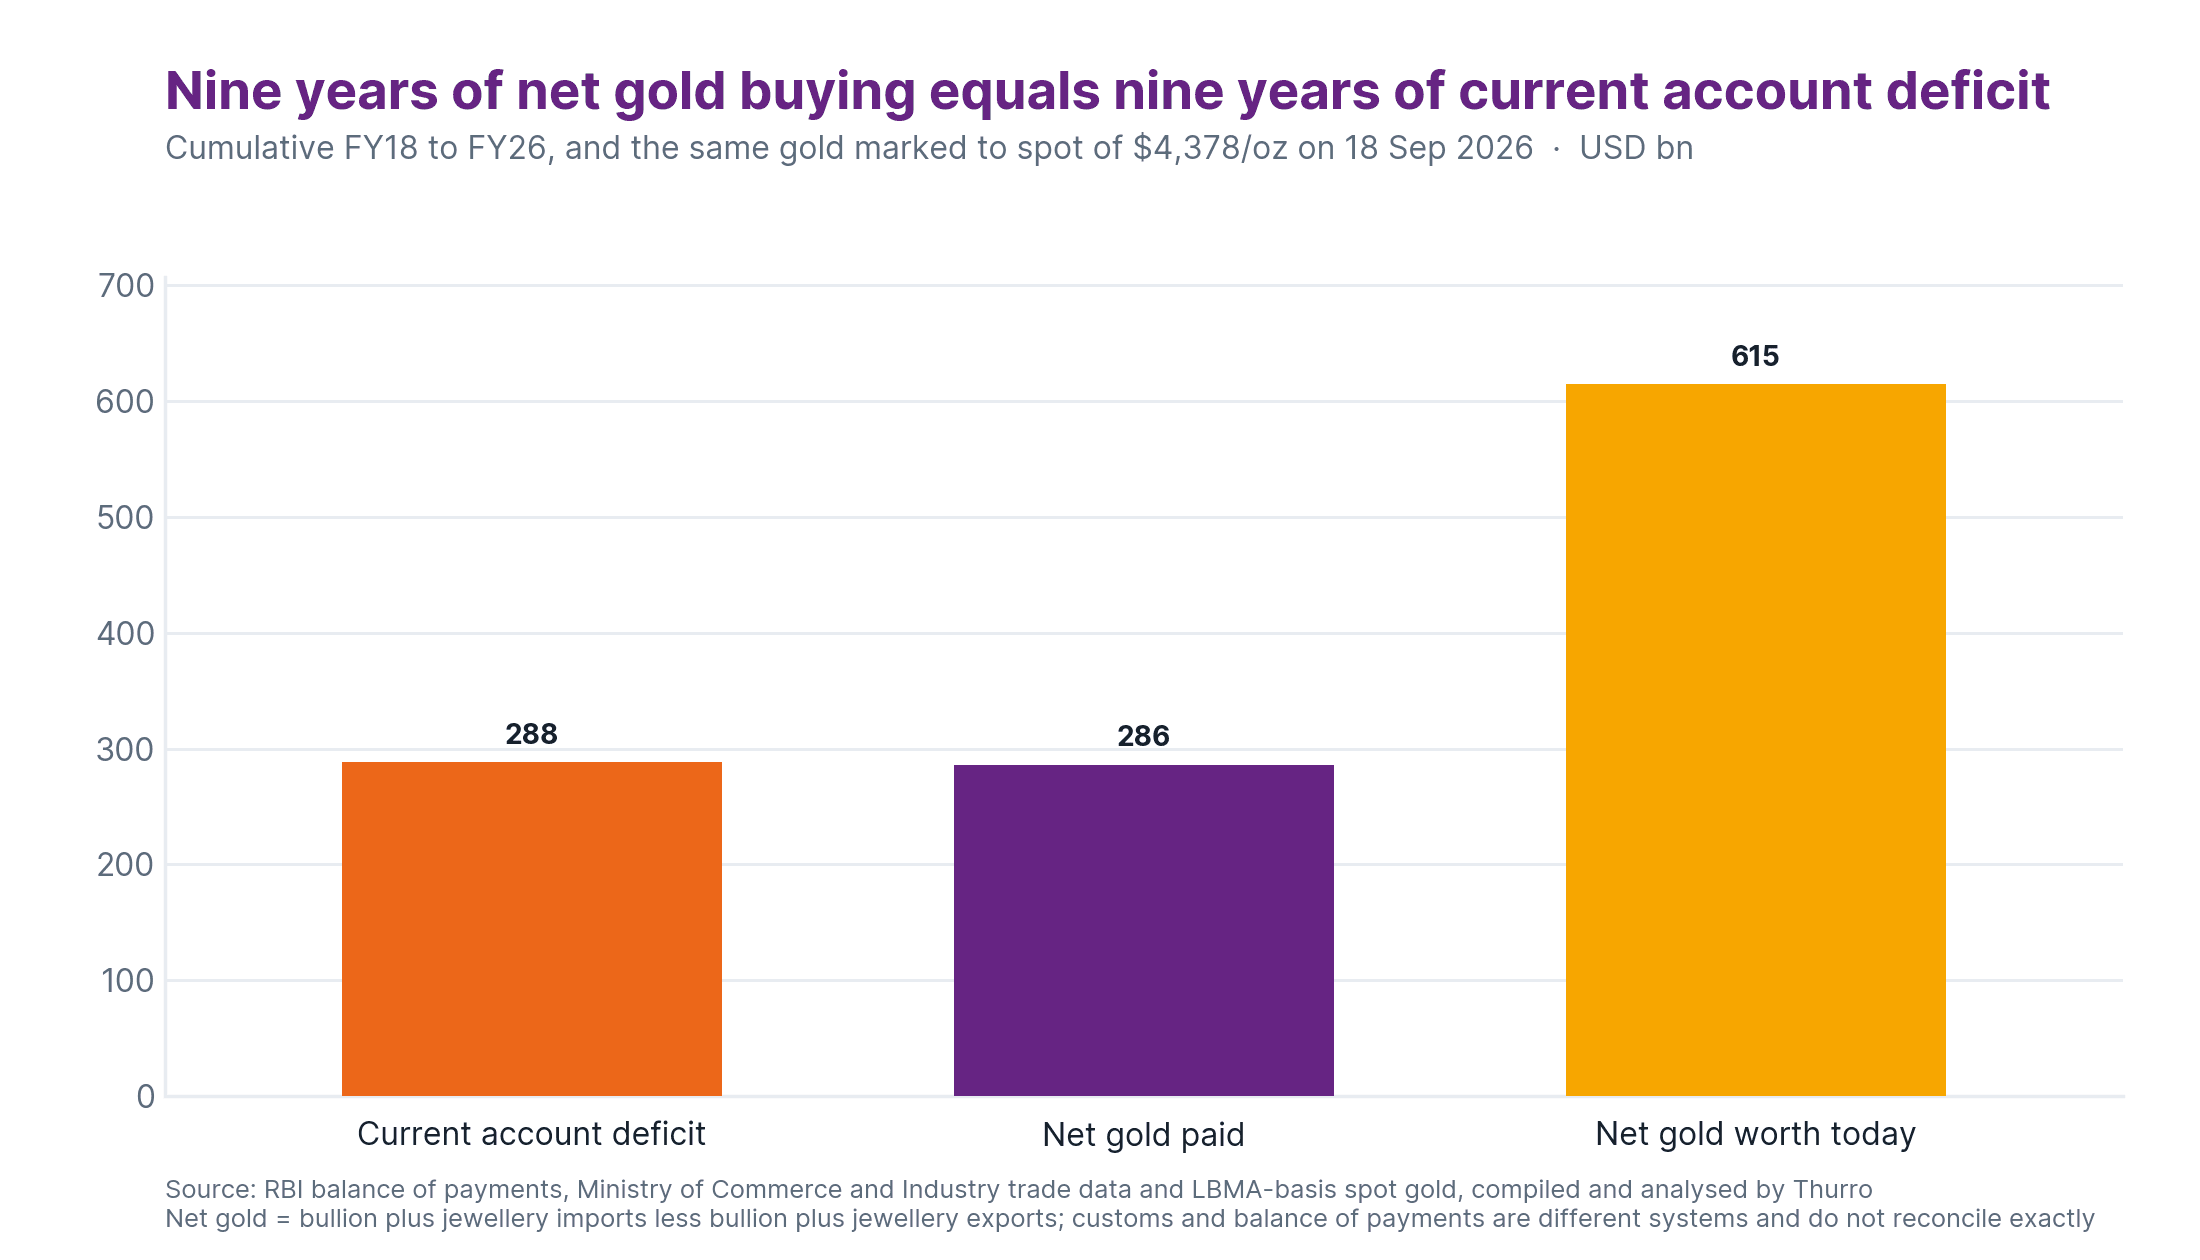
- Net gold outflow of $286.2bn over FY18 to FY26 sits within 1% of the cumulative current account deficit of $288.4bn. Marked at spot today, the same metal is worth $614.6bn — 2.15 times the money.
- Over this window India’s external deficit is arithmetically a savings allocation rather than a competitiveness gap. The FY26 rise in the bill is price: implied tonnage has averaged 485 tonnes a year and fell in FY26.
In May 2026 the government put the import duty on gold and silver back up to 15%, from 6%, explicitly to curb precious-metal imports, reduce pressure on the current account deficit and support the rupee. The logic is familiar, and it worked in 2013: gold is the discretionary part of the import bill, so squeeze it and the deficit narrows.
What the framing leaves out is the other side of the entry. Nine years of gold buying is treated as a cost, and nobody has put a value on what the outflow bought. So we did.
The finding
Between FY18 and FY26 India ran a cumulative current account deficit of $288.4bn. Over the same nine years it paid out $286.2bn, net, for gold — bullion and jewellery in, bullion and jewellery out. The two are within 1% of each other.
This is not an accounting identity. The deficit and the gold bill are measured in different statistical systems, and neither one causes the other. But the scale is close enough to make a point that usually gets lost in the duty debate: across this period, India’s external deficit and its gold purchases are the same size. Strip out net gold trade and the current account turns positive from FY24, at $6.3bn, then $24.1bn in FY25 and $37.5bn in FY26. Every other component nets to a surplus.
The second half of the arithmetic is what the outflow bought. Converting each year’s spend into ounces at that year’s average spot price gives about 140.4mn ounces, or roughly 4,366 tonnes. At spot of $4,378.17 an ounce on 18 September 2026, that stock is worth $614.6bn — 2.15 times the money, and a paper gain of $328bn that is itself larger than the cumulative deficit.
Two things follow from this, and a third does not. The deficit discussed as a macro vulnerability is, over this window, a savings allocation rather than a competitiveness gap, and it was funded out of services exports and remittances rather than borrowed money. The allocation has also appreciated materially. What does not follow is that it was a good use of the money. Metal in lockers earns nothing, sits outside the formal financial system, and cannot be reached by the sovereign; the monetisation schemes have never come close. The gain is real, unrealised, and idle.
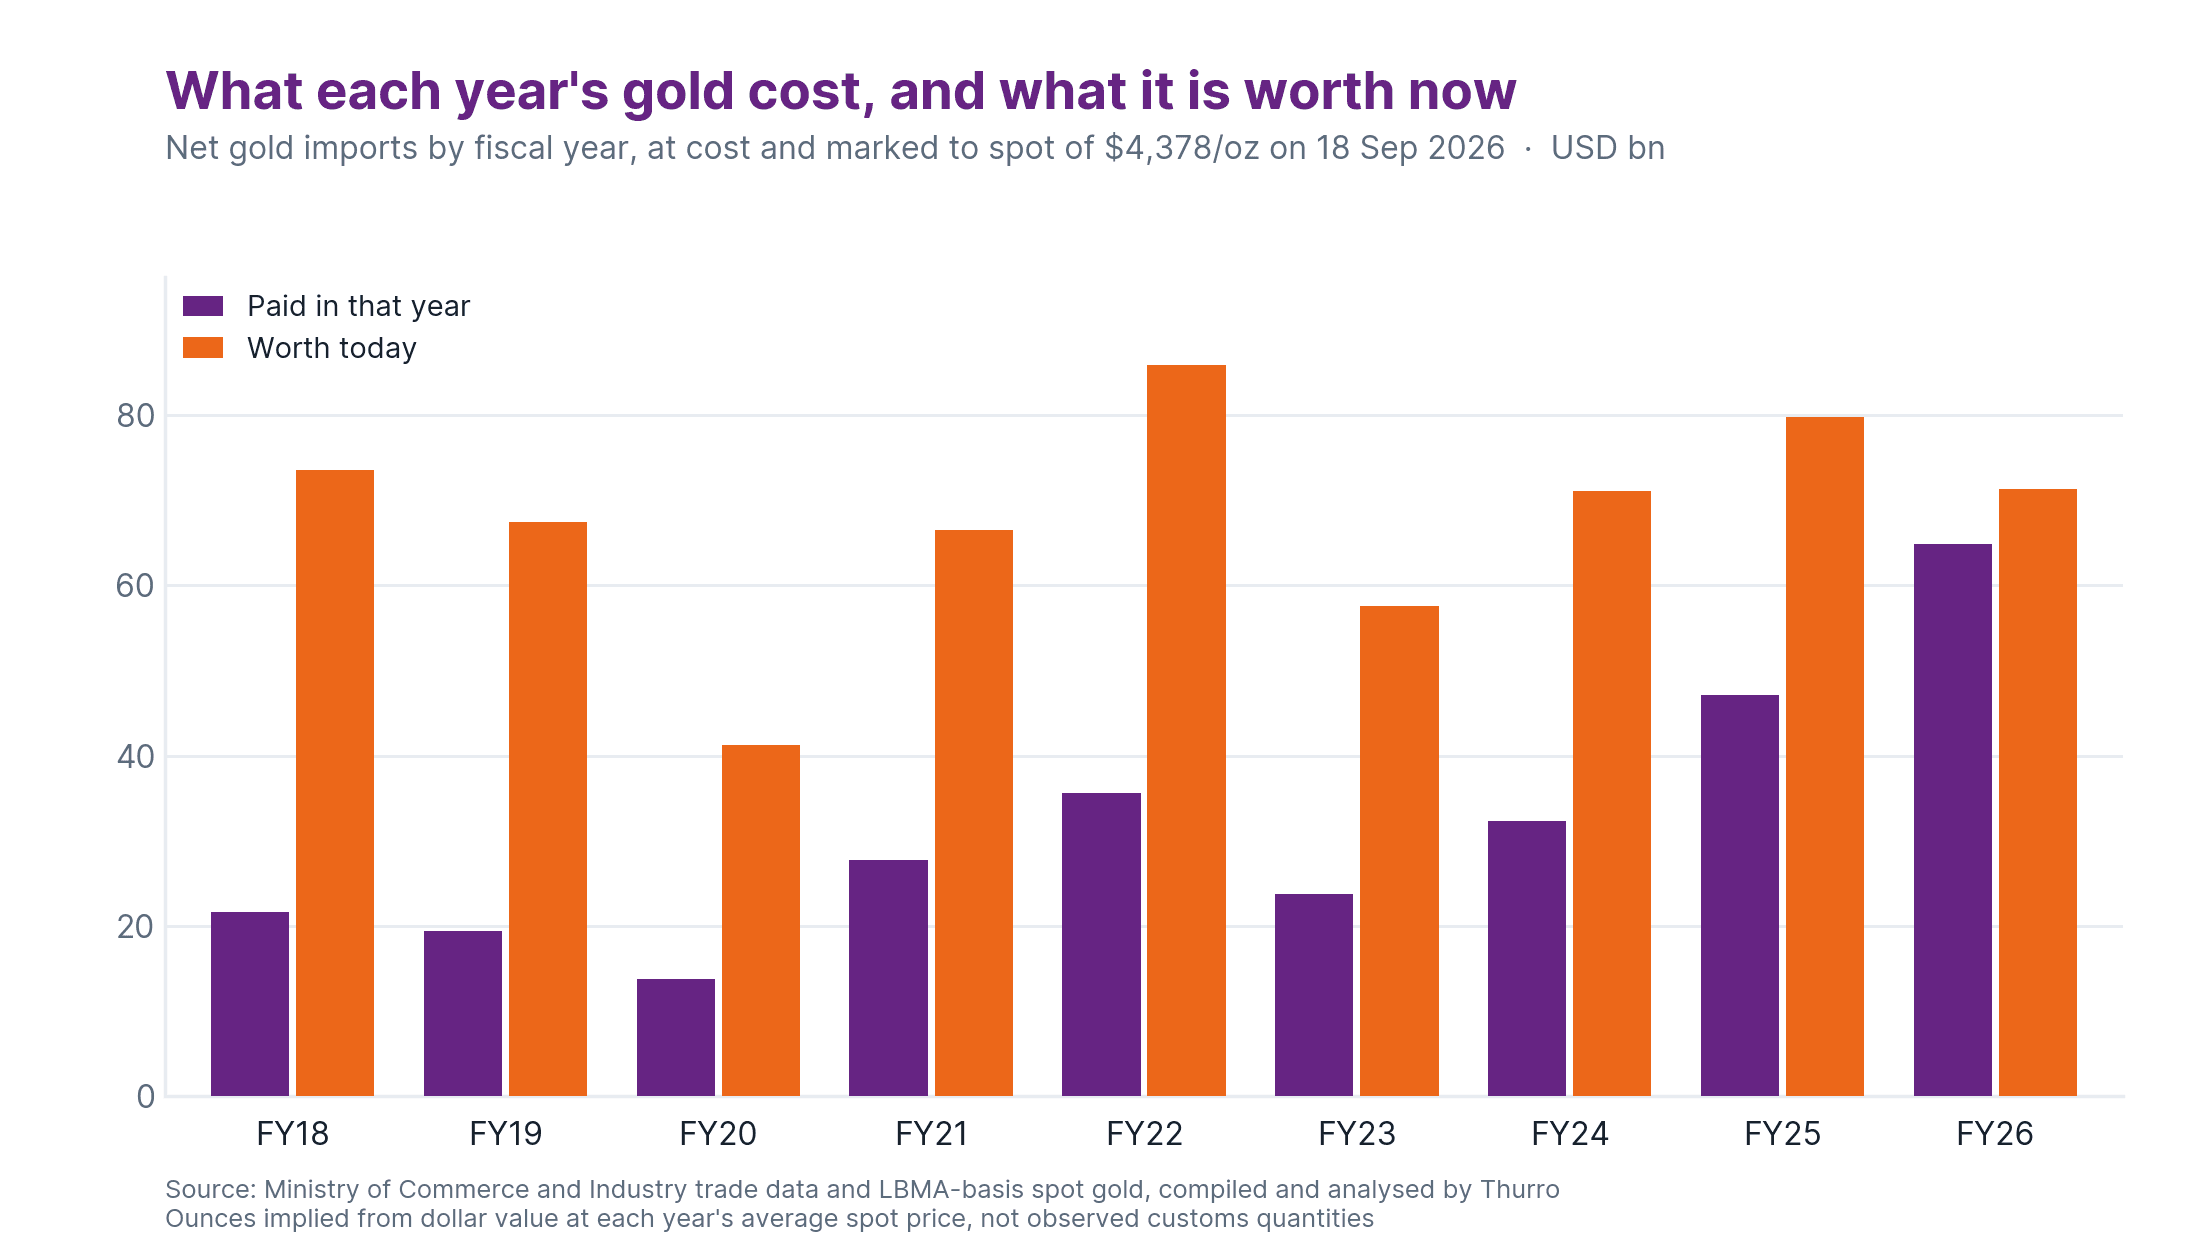
The gain is not evenly spread, and it is not purely an artefact of marking at a record price. The FY18 to FY20 tranches are up roughly three times each. The FY26 tranche, bought at an average of $3,982 an ounce, is up 1.10 times. Marked a year ago the multiple would have been lower, not absent.
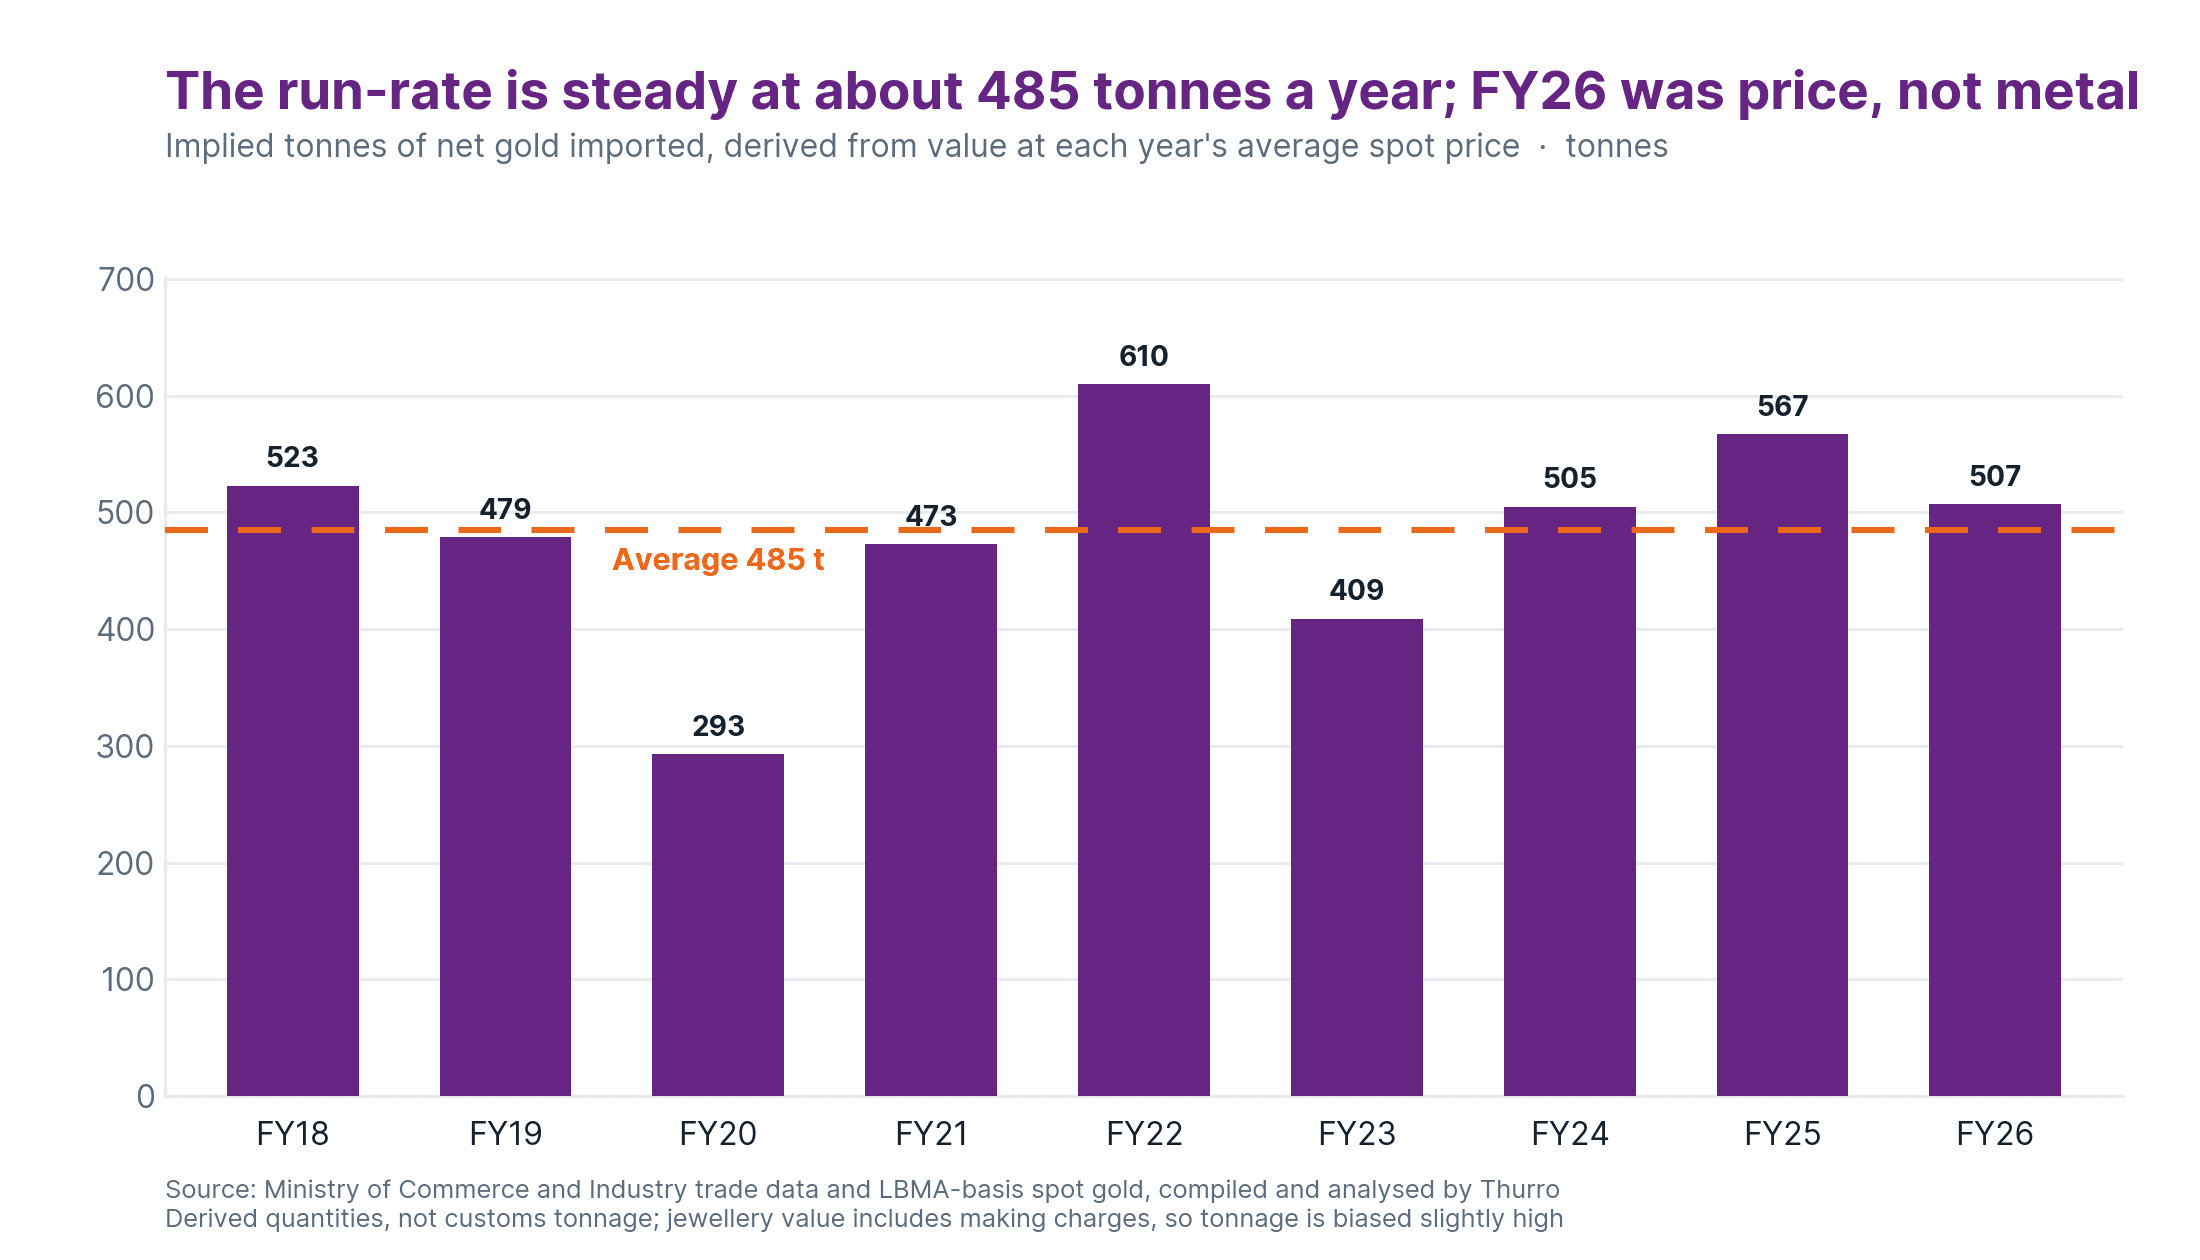
The FY26 bill of $64.9bn reads as a demand surge. It is not one. Implied tonnage fell from 567 tonnes in FY25 to 507 in FY26 while the dollar figure rose 38%, because the average price went from $2,581 to $3,982. Across the nine years the average is 485 tonnes.
Only two years break the pattern: FY20 at 293 tonnes and FY23 at 409. Everything else sits between 473 and 610. That stability is the practical point. Because tonnage barely moves, year-on-year changes in the gold import bill are close to a pure price series, and should not be read as a change in Indian demand.
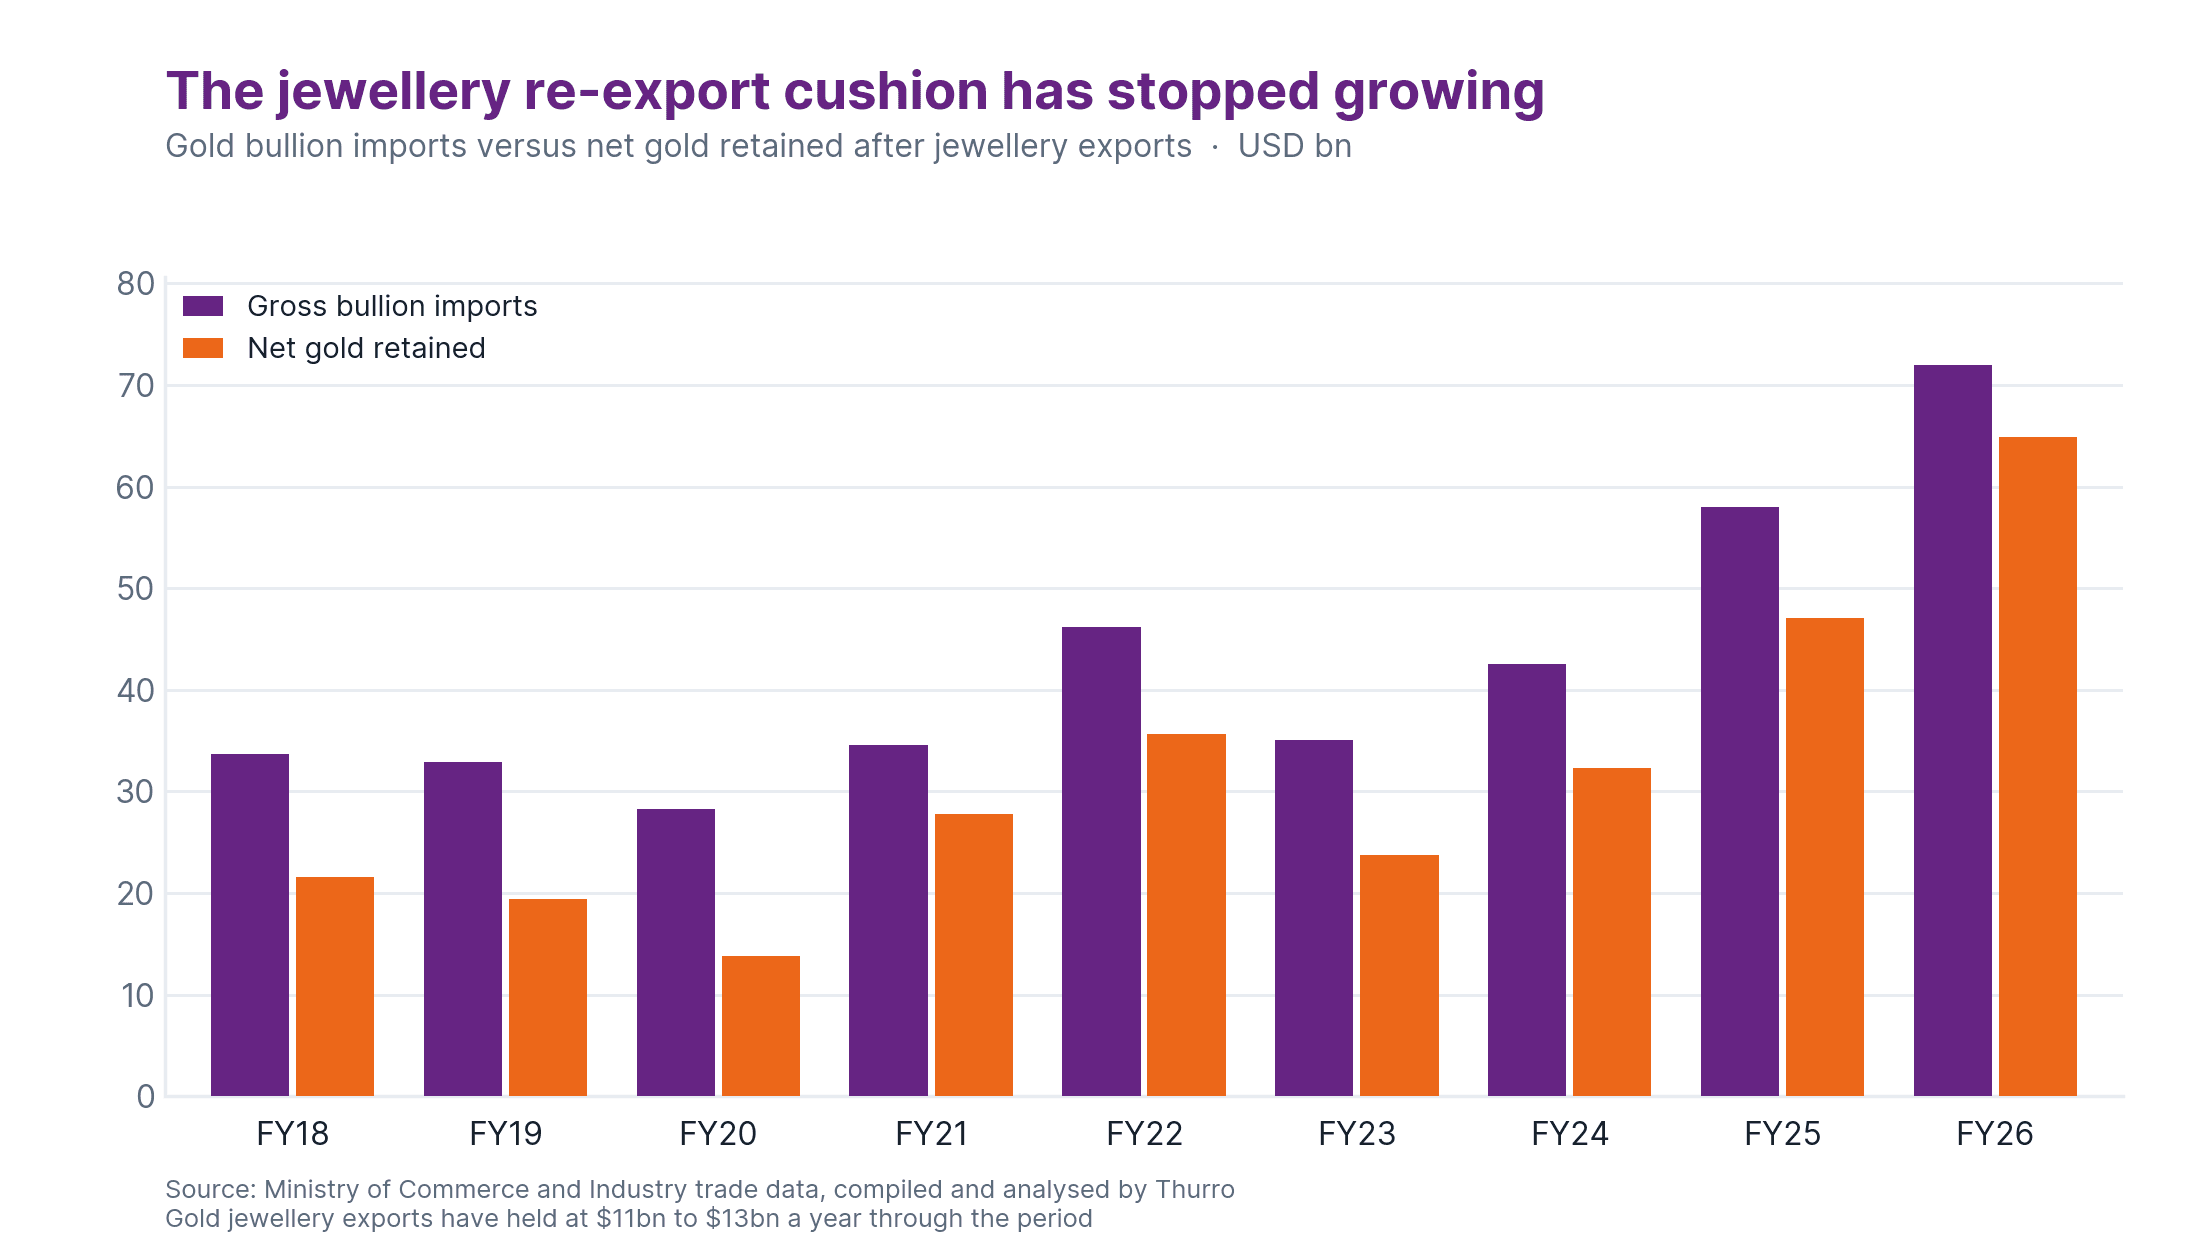
One point to be explicit about: we net. Gross bullion imports were $71.98bn in FY26 against the $64.85bn used here. The difference is jewellery exports, which have sat between $11bn and $13bn a year since FY12 while bullion imports doubled. The re-export cushion is real, and it is shrinking as a share of the bill.
Despite the challenging and turbulent global macroeconomic environment, India’s current account deficit in 2025-26 remained modest and much below the levels considered to be sustainable for emerging markets. In Q1:2026-27, India’s merchandise trade deficit widened to US$86.6 billion from US$68.7 billion in Q1:2025-26, mainly driven by imports of crude oil, electronic goods and gold.
Governor, Reserve Bank of India, monetary policy statement, Q2 FY27
The Governor’s read and ours agree on the arithmetic. Gold is named among the drivers of the widening trade deficit, and it is one. Our addition is the other side of the entry: this outflow has an asset standing against it, and that asset has appreciated.
What to watch
Watch tonnage, not the bill. If the May 2026 duty increase is working, implied tonnage should fall below the 485-tonne run-rate through FY27 — the dollar figure will keep climbing on price alone and will tell you little. Watch the gap at the front of the series too: the mark-to-market starts at FY18 because our daily gold price history begins in January 2017, and FY13 to FY17 carry a further $100bn of net gold we have not valued. And watch whether any of this metal moves. A $328bn unrealised gain outside the banking system is a policy opportunity only if it can be reached.
Sources and method
- Source: RBI balance of payments, quarterly, current methodology, compiled and analysed by Thurro
- Source: Ministry of Commerce and Industry, monthly imports and cumulative monthly exports by commodity group (gems and jewellery), compiled and analysed by Thurro
- Source: LBMA-basis daily spot gold in USD per troy ounce, compiled and analysed by Thurro
- Source: Governor’s statement, Reserve Bank of India, Q2 FY27
- Source: gold and silver import duty raised from 6% to 15% in May 2026, industry section of a SEBI-filed offer document, July 2026
- Method: net gold = (gold bullion + gold jewellery imports) less (gold bullion + gold jewellery exports). This is our construction, not an official published series. Implied ounces and tonnes are derived from dollar value at each year’s average spot price, not observed customs quantities; jewellery value includes making charges and stones, so implied tonnage is biased slightly high. Customs-basis trade data and RBI balance of payments are different statistical systems and do not reconcile exactly. Marked at $4,378.17 per troy ounce on 18 September 2026, with no allowance for duty paid, fabrication loss, resale, pledging or monetisation.
Unlock the power of alternative data
Do not just follow the market — stay ahead of it. Thurro helps you transform raw filings and alternative datasets into actionable insights.
Explore Thurro AltData Book a demoRelated Articles
The UPI MDR pool is about ₹1,000 crore a month, and two-thirds of it sits where nobody can see it
Parliament has cleared the way for merchant charges on UPI. The merchant-category data says the revenue is real…
India’s commodity trade is running on price, not volume
India's trade value is still climbing — imports up about 18 percent and exports about 8 percent in…
India’s net FDI has all but vanished — even as foreign money keeps pouring in
FY26 balance-of-payments data is in: gross inflows hit a record, yet net FDI is barely above zero. What's…