Unlock the power of uncommon India data
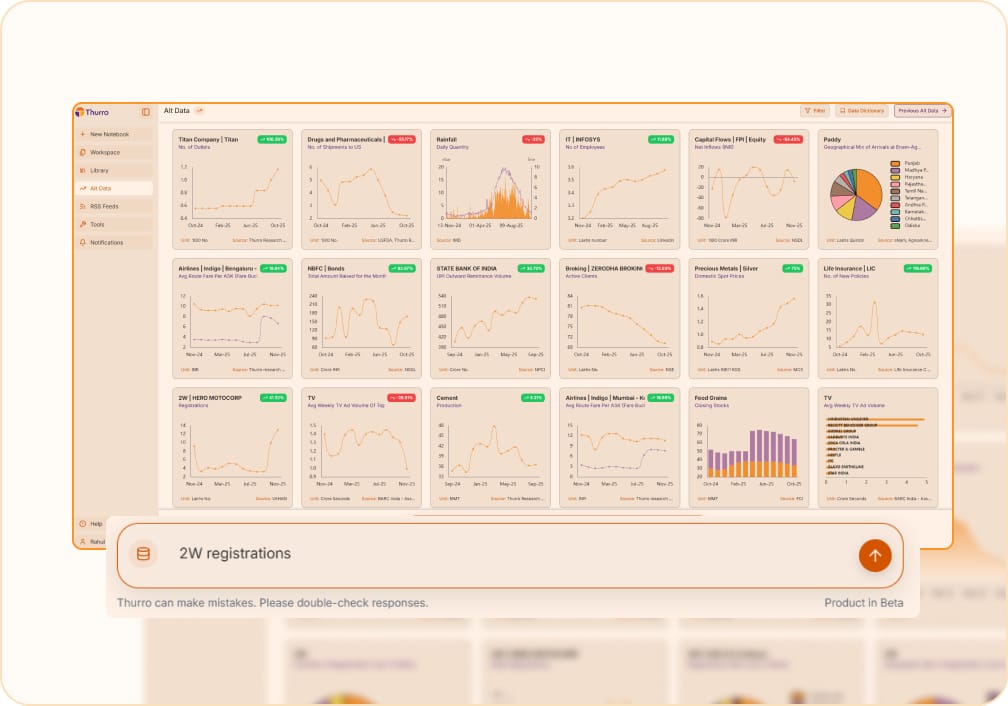
Access India’s richest repository of alternative data visualisations. Deploy instant insights and analytical power through pre-built dashboards
Key benefits
Instant visual analysis
Access over 500,000+ continuously refreshed, ready-to-use metrics with extensive historical data across 15+ sectors
Credible and validated insights
Rely on data points validated by machine intelligence and human curation, sourced from over 800 credible public sources
Enhanced discovery
Go beyond traditional data with unique metrics not easily accessible elsewhere
Deep analysis
Leverage advanced features like trend analysis and chart merging for comprehensive understanding
Collaborative decision making
Share boards, add comments, and make data-driven decisions together within a platform built for organisational collaboration
Uncover hidden opportunities
Gain a distinct edge by identifying emerging trends and overlooked investment opportunities before the broader market
Key features
Search
Instantly find relevant metrics, companies, or sectors with powerful filtering capabilities to zero in on what matters most to your analysis
Watchlists
Create personalised monitoring dashboards by pinning specific charts to track key business metrics that matter most to your analysis or strategy
")
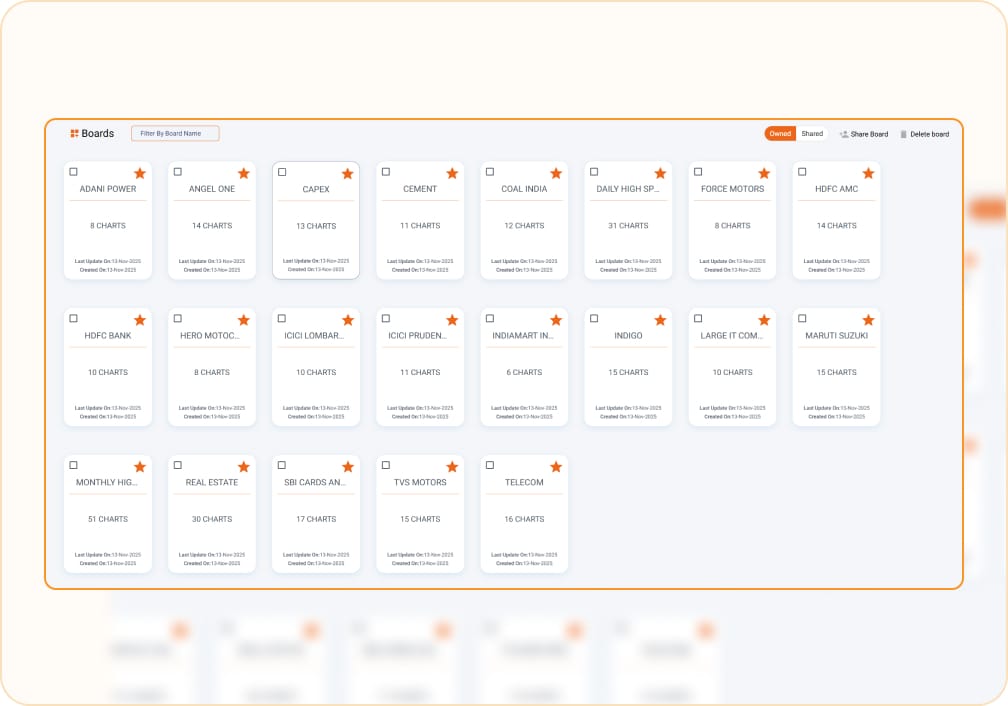
Boards
Build and organise your own collections of metrics for tailored business and market segment monitoring across various datasets and visualization types
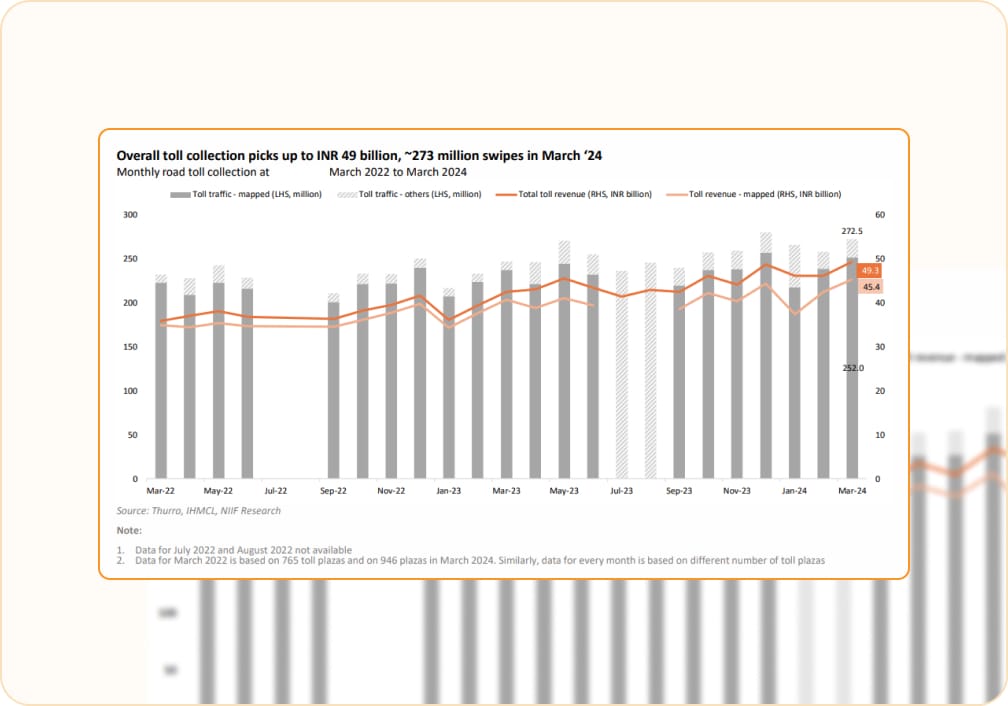
Reports
Customise charts and generate scheduled, branded reports in multiple export formats for further analysis, presentations, or stakeholder communications
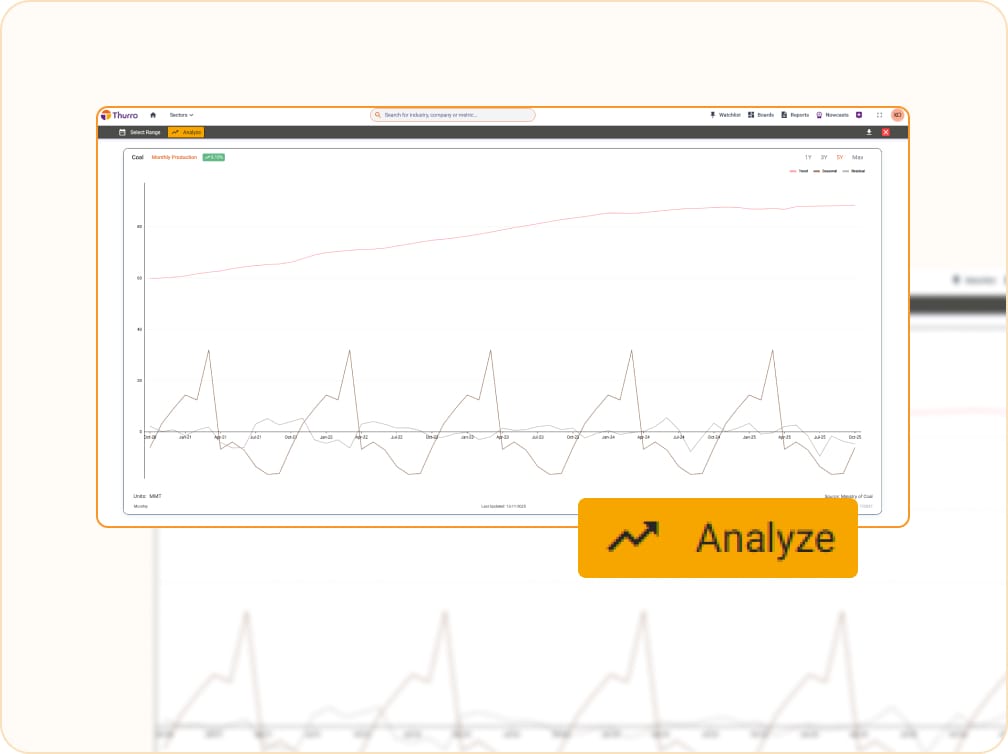
Analytics
Built-in advanced analytics allow you to leverage trend analysis and chart merge capabilities directly within the platform for comprehensive understanding and deeper insights
Types of analyses supported

Growth
Year-on-year, compounded annual growth rate calculations to track performance over time

De-average
Long-term trend, seasonality, noise separation for deeper pattern recognition
Averages
Per unit price, per card spend, and other normalized metrics for accurate comparisons

Indices
Value, volume, wage indices to track relative changes over time
Affinity
Proprietary calculation of market shares to understand customer preferences
Prices
Average export (import) price analysis to track international trade dynamics
Location analysis
District or pin-code level analysis of economic activity for geographical insights
Mix analysis
Trade by countries, state level sales analysis to understand market composition
Market shares
Across brands in a segment to track competitive positioning in the marketplace
Trending attributes
Attribute trends of fast moving products to identify emerging consumer preferences
Industry concentration
Herfindahl-Hirschman index to measure market concentration and competitive landscape
NowCast
Proprietary calculation of ongoing revenues or operational performance of a company in real-time
Explore our Data dictionary
Need to see everything we track? Access the live list of all our alternative data points. You can see detailed descriptions, sectors, and last-updated dates for every chart in our repository